
Edgar Sanchez
Senior Product Designer
Senior Product Designer
Building clear, trustworthy experiences for data-heavy enterprise platforms focused on observability and analytics-driven decision-making.
Recently at
"/><stop offset="1" stop-color="rgb(62, 0, 125)"/></linearGradient><linearGradient id="so9pZOzRm-912244671-linear-gradient" x1="0.9670991637467642" x2="0.03290083625323581" y1="0" y2="1"><stop offset="0" stop-color="rgb(18, 210, 222)"/><stop offset="1" stop-color="rgba(255, 255, 255, 0)"/></linearGradient><linearGradient id="WlitlvcVG-912244671-linear-gradient" x1="0.00006823306118247663" x2="0.9999317669388175" y1="0" y2="1"><stop offset="0" stop-color="rgb(18, 210, 222)"/><stop offset="1" stop-color="rgb(0, 72, 77)"/></linearGradient></defs><path d="M 12.466 3.807 C 11.282 2.635 9.848 2.049 8.162 2.049 C 6.486 2.049 5.05 2.635 3.859 3.807 C 2.675 4.97 2.083 6.382 2.083 8.038 C 2.083 9.688 2.675 11.099 3.859 12.271 C 5.05 13.435 6.486 14.017 8.162 14.017 C 9.848 14.017 11.282 13.435 12.466 12.271 C 13.657 11.099 14.254 9.688 14.254 8.038 C 14.254 6.382 13.657 4.97 12.466 3.807 Z M 13.946 13.714 C 12.352 15.282 10.425 16.065 8.162 16.065 C 5.909 16.065 3.984 15.282 2.391 13.714 C 0.797 12.147 0 10.256 0 8.038 C 0 5.815 0.797 3.918 2.391 2.351 C 3.984 0.784 5.909 0 8.162 0 C 10.425 0 12.352 0.784 13.946 2.351 C 15.54 3.918 16.336 5.815 16.336 8.038 C 16.336 10.256 15.54 12.147 13.946 13.714 Z" fill="rgb(255, 255, 255)" height="16.06542px" id="qVjj0SO8m" transform="translate(26.505 7.646)" width="16.336199999999998px"/><path d="M 6.557 2.049 L 1.036 2.049 C 0.747 2.049 0.504 1.948 0.308 1.747 C 0.103 1.545 0 1.303 0 1.019 C 0 0.743 0.103 0.504 0.308 0.303 C 0.504 0.101 0.747 0 1.036 0 L 6.557 0 C 8.022 0 9.275 0.512 10.315 1.534 C 11.362 2.564 11.885 3.799 11.885 5.24 C 11.885 6.687 11.362 7.923 10.315 8.946 C 9.275 9.968 8.022 10.48 6.557 10.48 L 2.084 10.48 L 2.084 15.047 C 2.084 15.331 1.981 15.57 1.776 15.764 C 1.57 15.965 1.324 16.065 1.036 16.065 C 0.747 16.065 0.504 15.965 0.308 15.764 C 0.103 15.57 0 15.331 0 15.047 L 0 9.46 C 0 9.177 0.103 8.934 0.308 8.733 C 0.504 8.531 0.747 8.43 1.036 8.43 L 6.557 8.43 C 7.453 8.43 8.216 8.121 8.846 7.501 C 9.484 6.874 9.802 6.12 9.802 5.24 C 9.802 4.358 9.484 3.604 8.846 2.978 C 8.216 2.358 7.453 2.049 6.557 2.049 Z" fill="rgb(255, 255, 255)" height="16.06542px" id="EnVBOD1Ha" transform="translate(47.461 7.646)" width="11.885199999999998px"/><path d="M 4.599 14.017 L 7.434 14.017 C 8.132 14.017 8.728 13.775 9.221 13.289 C 9.714 12.805 9.962 12.222 9.962 11.543 C 9.962 10.857 9.714 10.271 9.221 9.785 C 8.728 9.3 8.132 9.057 7.434 9.057 L 4.599 9.057 C 3.332 9.057 2.25 8.613 1.355 7.726 C 0.452 6.844 0 5.777 0 4.523 C 0 3.277 0.452 2.213 1.355 1.332 C 2.25 0.444 3.332 0 4.599 0 L 7.434 0 C 8.702 0 9.787 0.444 10.69 1.332 C 11.592 2.213 12.044 3.277 12.044 4.523 C 12.044 4.807 11.943 5.049 11.737 5.251 C 11.532 5.452 11.286 5.553 10.998 5.553 C 10.709 5.553 10.466 5.452 10.269 5.251 C 10.063 5.049 9.962 4.807 9.962 4.523 C 9.962 3.844 9.714 3.262 9.221 2.776 C 8.728 2.292 8.132 2.049 7.434 2.049 L 4.599 2.049 C 3.909 2.049 3.316 2.292 2.823 2.776 C 2.33 3.262 2.084 3.844 2.084 4.523 C 2.084 5.21 2.33 5.796 2.823 6.281 C 3.316 6.766 3.909 7.009 4.599 7.009 L 7.434 7.009 C 8.702 7.009 9.787 7.452 10.69 8.341 C 11.592 9.221 12.044 10.289 12.044 11.543 C 12.044 12.79 11.592 13.853 10.69 14.734 C 9.787 15.622 8.702 16.065 7.434 16.065 L 4.599 16.065 C 3.332 16.065 2.25 15.622 1.355 14.734 C 0.452 13.853 0 12.79 0 11.543 C 0 11.26 0.103 11.016 0.308 10.815 C 0.504 10.613 0.747 10.513 1.036 10.513 C 1.324 10.513 1.57 10.613 1.776 10.815 C 1.981 11.016 2.084 11.26 2.084 11.543 C 2.084 12.222 2.33 12.805 2.823 13.289 C 3.316 13.775 3.909 14.017 4.599 14.017 Z" fill="rgb(255, 255, 255)" height="16.06542px" id="INGVO_Wzh" transform="translate(63.954 7.646)" width="12.0441px"/><path d="M 17.092 8.665 C 17.595 9.162 18.327 9.384 19.034 9.257 C 19.925 9.096 20.627 8.399 20.771 7.528 C 20.885 6.847 20.649 6.153 20.142 5.676 L 17.699 3.373 C 17.453 3.141 17.444 2.756 17.68 2.514 C 17.917 2.273 18.307 2.264 18.554 2.497 L 20.996 4.798 C 21.797 5.554 22.169 6.648 21.99 7.723 C 21.761 9.11 20.654 10.201 19.256 10.452 C 18.156 10.65 17.011 10.305 16.218 9.523 L 8.263 1.667 C 7.652 1.064 6.659 1.064 6.048 1.667 L 1.835 5.833 C 1.279 6.382 1.091 7.195 1.351 7.927 C 1.626 8.707 2.357 9.245 3.196 9.284 L 3.226 9.285 C 3.808 9.313 4.375 9.102 4.793 8.703 L 8.305 5.35 C 8.549 5.116 8.941 5.122 9.179 5.362 C 9.417 5.603 9.41 5.988 9.165 6.221 L 5.654 9.575 C 4.991 10.208 4.09 10.543 3.166 10.498 L 3.136 10.497 C 1.793 10.434 0.625 9.575 0.183 8.326 C -0.231 7.156 0.07 5.855 0.959 4.976 L 5.173 0.811 C 6.266 -0.269 8.044 -0.271 9.138 0.81 Z" fill="rgb(167, 80, 255)" height="10.50699506938033px" id="P46hxKawJ" transform="translate(0.451 16.028)" width="22.034166672414884px"/><path d="M 3.227 2.228 C 3.471 2.46 3.48 2.843 3.244 3.084 C 3.01 3.325 2.621 3.332 2.376 3.101 L 0.189 1.041 C -0.055 0.809 -0.064 0.426 0.171 0.186 C 0.405 -0.055 0.794 -0.063 1.04 0.168 Z" fill="url(%23oUKf_Mt33-912244671-linear-gradient)" height="3.269718961731165px" id="oUKf_Mt33" transform="translate(18.068 18.457)" width="3.415445540078455px"/><path d="M 2.658 1.771 C 2.658 2.236 2.274 2.613 1.801 2.613 C 1.328 2.613 0.945 2.236 0.945 1.771 C 0.945 1.307 1.328 0.928 1.801 0.928 C 2.274 0.928 2.658 1.307 2.658 1.771 Z M 1.801 0 C 0.806 0 0 0.794 0 1.771 C 0 2.749 0.806 3.543 1.801 3.543 C 2.795 3.543 3.603 2.749 3.603 1.771 C 3.603 0.794 2.795 0 1.801 0 Z" fill="rgb(167, 80, 255)" height="3.5426px" id="QsO41Pa4U" transform="translate(15.754 16.153)" width="3.6026000000000007px"/><path d="M 4.941 1.842 C 4.44 1.345 3.706 1.123 3.001 1.25 C 2.108 1.411 1.408 2.108 1.262 2.979 C 1.15 3.66 1.385 4.353 1.892 4.831 L 4.336 7.134 C 4.582 7.366 4.59 7.751 4.354 7.993 C 4.118 8.234 3.728 8.243 3.481 8.01 L 1.037 5.709 C 0.238 4.953 -0.134 3.859 0.044 2.784 C 0.274 1.397 1.381 0.307 2.778 0.055 C 3.879 -0.143 5.023 0.201 5.817 0.984 L 13.772 8.84 C 14.383 9.443 15.375 9.443 15.986 8.84 L 20.199 4.674 C 20.755 4.125 20.943 3.312 20.684 2.58 C 20.408 1.8 19.678 1.262 18.839 1.223 L 18.809 1.222 C 18.227 1.194 17.659 1.405 17.241 1.804 L 13.73 5.157 C 13.484 5.391 13.094 5.385 12.856 5.144 C 12.618 4.904 12.623 4.52 12.869 4.286 L 16.381 0.932 C 17.044 0.3 17.944 -0.035 18.867 0.009 L 18.898 0.01 C 20.24 0.073 21.409 0.932 21.851 2.181 C 22.265 3.351 21.965 4.652 21.075 5.531 L 16.862 9.696 C 15.768 10.777 13.99 10.778 12.896 9.697 Z" fill="rgb(0, 209, 222)" height="10.507122345856565px" id="QHZRaFDrf" transform="translate(0.468 4.875)" width="22.033881152126302px"/><path d="M 2.358 0.172 C 2.6 -0.062 2.991 -0.057 3.228 0.184 C 3.465 0.424 3.46 0.807 3.216 1.041 L 1.046 3.114 C 0.801 3.347 0.412 3.342 0.174 3.101 C -0.063 2.862 -0.058 2.478 0.186 2.245 Z" fill="url(%23so9pZOzRm-912244671-linear-gradient)" height="3.2856100477464762px" id="so9pZOzRm" transform="translate(13.145 6.922)" width="3.4024945006485545px"/><path d="M 0.19 1.044 C -0.056 0.812 -0.064 0.429 0.171 0.186 C 0.407 -0.055 0.797 -0.063 1.044 0.168 L 3.227 2.226 C 3.474 2.458 3.481 2.843 3.246 3.084 C 3.009 3.326 2.619 3.334 2.374 3.102 Z" fill="url(%23WlitlvcVG-912244671-linear-gradient)" height="3.27080967758973px" id="WlitlvcVG" transform="translate(1.48 9.694)" width="3.4173487759730996px"/><path d="M 0.945 1.771 C 0.945 1.307 1.328 0.928 1.801 0.928 C 2.274 0.928 2.658 1.307 2.658 1.771 C 2.658 2.236 2.274 2.614 1.801 2.614 C 1.328 2.614 0.945 2.236 0.945 1.771 Z M 1.801 3.543 C 2.795 3.543 3.603 2.749 3.603 1.771 C 3.603 0.793 2.795 0 1.801 0 C 0.806 0 0 0.793 0 1.771 C 0 2.749 0.806 3.543 1.801 3.543 Z" fill="rgb(0, 209, 222)" height="3.5426px" id="szHFUqDe3" transform="translate(3.596 11.714)" width="3.6026px"/></svg>)
$40M Funding
Featured in
XOPS is an enterprise intelligence platform that connects people, devices, and software through a living knowledge graph, enabling real-time visibility and autonomous operations.
Owned Control Center design at XOPS— the observability platform for enterprise IT operations. Drove experiences across lifecycle management, data governance, supply chain operations, and operational intelligence, enabling Fortune 500 customers to achieve:
Owned Control Center design at XOPS— the observability platform for enterprise IT operations.
Drove experiences across lifecycle management, data governance, supply chain operations, and operational intelligence, enabling Fortune 500 customers to achieve:
Process Acceleration
60%
Faster operations across IT initiatives
Faster operations across IT initiatives
Process Acceleration
60%
Process Acceleration
60%
Faster operations across IT initiatives
Process Acceleration
60%
Faster operations across IT initiatives
Operational Efficiency
95%
Reduction in manual work for major initiatives
Reduction in manual work for major initiatives
Operational Efficiency
95%
Operational Efficiency
95%
Reduction in manual work for major initiatives
Operational Efficiency
95%
Reduction in manual work for major initiatives
Error Reduction
80%
Fewer errors across operations
Fewer errors across operations
Error Reduction
80%
Error Reduction
80%
Fewer errors across operations
Error Reduction
80%
Fewer errors across operations
Cost Savings
20%
Cost reduction through automation
Cost reduction through automation
Cost Savings
20%
Cost Savings
20%
Cost reduction through automation
Cost Savings
20%
Cost reduction through automation
Source
Selected Work
"/><stop offset="1" stop-color="rgb(62, 0, 125)"/></linearGradient><linearGradient id="JIyDIpeUE-1796897149-linear-gradient" x1="0.967093203614894" x2="0.03290679638510591" y1="0" y2="1"><stop offset="0" stop-color="rgb(18, 210, 222)"/><stop offset="1" stop-color="rgba(255, 255, 255, 0)"/></linearGradient><linearGradient id="VUDsD31pW-1796897149-linear-gradient" x1="0.00007278097107799031" x2="0.999927219028922" y1="0" y2="1"><stop offset="0" stop-color="rgb(18, 210, 222)"/><stop offset="1" stop-color="rgb(0, 72, 77)"/></linearGradient></defs><path d="M 9.349 2.855 C 8.462 1.977 7.386 1.537 6.122 1.537 C 4.864 1.537 3.788 1.977 2.894 2.855 C 2.007 3.728 1.563 4.786 1.563 6.029 C 1.563 7.266 2.007 8.324 2.894 9.203 C 3.788 10.076 4.864 10.513 6.122 10.513 C 7.386 10.513 8.462 10.076 9.349 9.203 C 10.243 8.324 10.691 7.266 10.691 6.029 C 10.691 4.786 10.243 3.728 9.349 2.855 Z M 10.46 10.286 C 9.264 11.461 7.819 12.049 6.122 12.049 C 4.432 12.049 2.988 11.461 1.793 10.286 C 0.598 9.11 0 7.692 0 6.029 C 0 4.361 0.598 2.939 1.793 1.763 C 2.988 0.588 4.432 0 6.122 0 C 7.819 0 9.264 0.588 10.46 1.763 C 11.655 2.939 12.252 4.361 12.252 6.029 C 12.252 7.692 11.655 9.11 10.46 10.286 Z" fill="rgb(255, 255, 255)" height="12.049039999999998px" id="naEly2nzf" transform="translate(19.879 5.735)" width="12.252099999999999px"/><path d="M 4.918 1.537 L 0.777 1.537 C 0.56 1.537 0.378 1.461 0.231 1.31 C 0.077 1.159 0 0.977 0 0.764 C 0 0.557 0.077 0.378 0.231 0.227 C 0.378 0.076 0.56 0 0.777 0 L 4.918 0 C 6.017 0 6.956 0.384 7.736 1.15 C 8.522 1.923 8.914 2.849 8.914 3.93 C 8.914 5.015 8.522 5.942 7.736 6.709 C 6.956 7.476 6.017 7.86 4.918 7.86 L 1.563 7.86 L 1.563 11.285 C 1.563 11.498 1.486 11.677 1.332 11.823 C 1.178 11.974 0.993 12.049 0.777 12.049 C 0.56 12.049 0.378 11.974 0.231 11.823 C 0.077 11.677 0 11.498 0 11.285 L 0 7.095 C 0 6.883 0.077 6.701 0.231 6.55 C 0.378 6.399 0.56 6.323 0.777 6.323 L 4.918 6.323 C 5.59 6.323 6.162 6.091 6.634 5.625 C 7.113 5.155 7.351 4.59 7.351 3.93 C 7.351 3.269 7.113 2.703 6.634 2.233 C 6.162 1.769 5.59 1.537 4.918 1.537 Z" fill="rgb(255, 255, 255)" height="12.049039999999998px" id="HncMSqNaO" transform="translate(35.596 5.735)" width="8.913899999999998px"/><path d="M 3.449 10.513 L 5.576 10.513 C 6.099 10.513 6.546 10.331 6.916 9.967 C 7.286 9.603 7.471 9.167 7.471 8.657 C 7.471 8.142 7.286 7.703 6.916 7.339 C 6.546 6.975 6.099 6.793 5.576 6.793 L 3.449 6.793 C 2.499 6.793 1.687 6.46 1.016 5.794 C 0.339 5.133 0 4.333 0 3.392 C 0 2.458 0.339 1.659 1.016 0.999 C 1.687 0.333 2.499 0 3.449 0 L 5.576 0 C 6.526 0 7.34 0.333 8.018 0.999 C 8.694 1.659 9.033 2.458 9.033 3.392 C 9.033 3.605 8.957 3.787 8.803 3.938 C 8.649 4.089 8.464 4.164 8.248 4.164 C 8.032 4.164 7.85 4.089 7.701 3.938 C 7.547 3.787 7.471 3.605 7.471 3.392 C 7.471 2.883 7.286 2.447 6.916 2.082 C 6.546 1.719 6.099 1.537 5.576 1.537 L 3.449 1.537 C 2.932 1.537 2.487 1.719 2.117 2.082 C 1.747 2.447 1.563 2.883 1.563 3.392 C 1.563 3.908 1.747 4.347 2.117 4.71 C 2.487 5.075 2.932 5.256 3.449 5.256 L 5.576 5.256 C 6.526 5.256 7.34 5.589 8.018 6.256 C 8.694 6.916 9.033 7.717 9.033 8.657 C 9.033 9.592 8.694 10.39 8.018 11.051 C 7.34 11.716 6.526 12.049 5.576 12.049 L 3.449 12.049 C 2.499 12.049 1.687 11.716 1.016 11.051 C 0.339 10.39 0 9.592 0 8.657 C 0 8.445 0.077 8.262 0.231 8.111 C 0.378 7.96 0.56 7.885 0.777 7.885 C 0.993 7.885 1.178 7.96 1.332 8.111 C 1.486 8.262 1.563 8.445 1.563 8.657 C 1.563 9.167 1.747 9.603 2.117 9.967 C 2.487 10.331 2.932 10.513 3.449 10.513 Z" fill="rgb(255, 255, 255)" height="12.049039999999998px" id="h9PmC2o_z" transform="translate(47.966 5.735)" width="9.033099999999997px"/><path d="M 12.819 6.499 C 13.197 6.871 13.746 7.038 14.276 6.943 C 14.944 6.822 15.471 6.299 15.578 5.646 C 15.664 5.135 15.486 4.615 15.106 4.257 L 13.274 2.53 C 13.09 2.356 13.083 2.067 13.26 1.886 C 13.438 1.705 13.731 1.698 13.915 1.873 L 15.747 3.599 C 16.348 4.165 16.627 4.986 16.493 5.792 C 16.321 6.832 15.49 7.651 14.442 7.839 C 13.617 7.988 12.758 7.729 12.163 7.142 L 6.197 1.251 C 5.739 0.798 4.994 0.798 4.536 1.251 L 1.376 4.375 C 0.959 4.786 0.819 5.396 1.013 5.945 C 1.219 6.53 1.767 6.934 2.397 6.963 L 2.42 6.964 C 2.856 6.985 3.281 6.827 3.595 6.527 L 6.229 4.012 C 6.412 3.837 6.706 3.842 6.884 4.022 C 7.062 4.202 7.058 4.491 6.874 4.666 L 4.24 7.181 C 3.743 7.656 3.067 7.907 2.375 7.874 L 2.352 7.873 C 1.345 7.825 0.469 7.181 0.137 6.245 C -0.173 5.367 0.053 4.392 0.719 3.732 L 3.88 0.608 C 4.699 -0.202 6.033 -0.203 6.853 0.607 Z" fill="rgb(167, 80, 255)" height="7.880263827721711px" id="SmlE08kmD" transform="translate(0.339 12.021)" width="16.525646514734348px"/><path d="M 2.42 1.671 C 2.603 1.845 2.61 2.132 2.433 2.313 C 2.258 2.494 1.966 2.499 1.782 2.326 L 0.141 0.781 C -0.042 0.607 -0.048 0.32 0.128 0.14 C 0.304 -0.041 0.596 -0.047 0.78 0.126 Z" fill="url(%23tWsbt4Gic-1796897149-linear-gradient)" height="2.4522882999724693px" id="tWsbt4Gic" transform="translate(13.552 13.842)" width="2.5616273768953963px"/><path d="M 1.993 1.329 C 1.993 1.677 1.705 1.96 1.35 1.96 C 0.996 1.96 0.709 1.677 0.709 1.329 C 0.709 0.98 0.996 0.696 1.35 0.696 C 1.705 0.696 1.993 0.98 1.993 1.329 Z M 1.351 0 C 0.604 0 0 0.595 0 1.329 C 0 2.062 0.604 2.657 1.351 2.657 C 2.097 2.657 2.702 2.062 2.702 1.329 C 2.702 0.595 2.097 0 1.351 0 Z" fill="rgb(167, 80, 255)" height="2.657px" id="ECV1ed7qT" transform="translate(11.815 12.115)" width="2.702px"/><path d="M 3.706 1.382 C 3.33 1.009 2.78 0.842 2.25 0.938 C 1.581 1.058 1.056 1.581 0.947 2.235 C 0.862 2.745 1.039 3.265 1.419 3.623 L 3.252 5.35 C 3.437 5.525 3.442 5.813 3.266 5.995 C 3.088 6.175 2.796 6.182 2.611 6.008 L 0.778 4.282 C 0.178 3.715 -0.101 2.895 0.033 2.088 C 0.205 1.048 1.036 0.23 2.083 0.041 C 2.909 -0.107 3.767 0.151 4.363 0.738 L 10.329 6.63 C 10.787 7.082 11.531 7.082 11.989 6.63 L 15.149 3.506 C 15.566 3.094 15.708 2.484 15.513 1.935 C 15.306 1.35 14.759 0.947 14.129 0.917 L 14.107 0.916 C 13.67 0.896 13.244 1.053 12.931 1.353 L 10.297 3.868 C 10.113 4.043 9.82 4.039 9.642 3.858 C 9.464 3.678 9.467 3.39 9.651 3.214 L 12.286 0.699 C 12.783 0.225 13.458 -0.027 14.151 0.007 L 14.173 0.008 C 15.18 0.055 16.057 0.699 16.388 1.636 C 16.699 2.514 16.473 3.489 15.806 4.148 L 12.646 7.272 C 11.826 8.082 10.492 8.083 9.672 7.273 Z" fill="rgb(0, 209, 222)" height="7.880353431179362px" id="fgE2NDIiJ" transform="translate(0.352 3.656)" width="16.525450082433984px"/><path d="M 1.768 0.129 C 1.95 -0.046 2.243 -0.043 2.421 0.138 C 2.599 0.318 2.595 0.605 2.412 0.781 L 0.785 2.335 C 0.601 2.511 0.309 2.507 0.131 2.326 C -0.047 2.146 -0.043 1.859 0.14 1.684 Z" fill="url(%23JIyDIpeUE-1796897149-linear-gradient)" height="2.464221235841098px" id="JIyDIpeUE" transform="translate(9.858 5.191)" width="2.5518964181335324px"/><path d="M 0.143 0.783 C -0.042 0.609 -0.048 0.322 0.129 0.14 C 0.305 -0.041 0.598 -0.047 0.783 0.126 L 2.42 1.67 C 2.605 1.844 2.611 2.132 2.434 2.313 C 2.257 2.495 1.964 2.5 1.78 2.327 Z" fill="url(%23VUDsD31pW-1796897149-linear-gradient)" height="2.4530962793489097px" id="VUDsD31pW" transform="translate(1.11 7.271)" width="2.563019076452434px"/><path d="M 0.709 1.328 C 0.709 0.98 0.996 0.696 1.35 0.696 C 1.705 0.696 1.993 0.98 1.993 1.328 C 1.993 1.677 1.705 1.961 1.35 1.961 C 0.996 1.961 0.709 1.677 0.709 1.328 Z M 1.35 2.657 C 2.097 2.657 2.702 2.062 2.702 1.328 C 2.702 0.595 2.097 0 1.35 0 C 0.604 0 0 0.595 0 1.328 C 0 2.062 0.604 2.657 1.35 2.657 Z" fill="rgb(0, 209, 222)" height="2.6569400000000005px" id="zc7kc8AYm" transform="translate(2.697 8.785)" width="2.70194px"/></svg>)
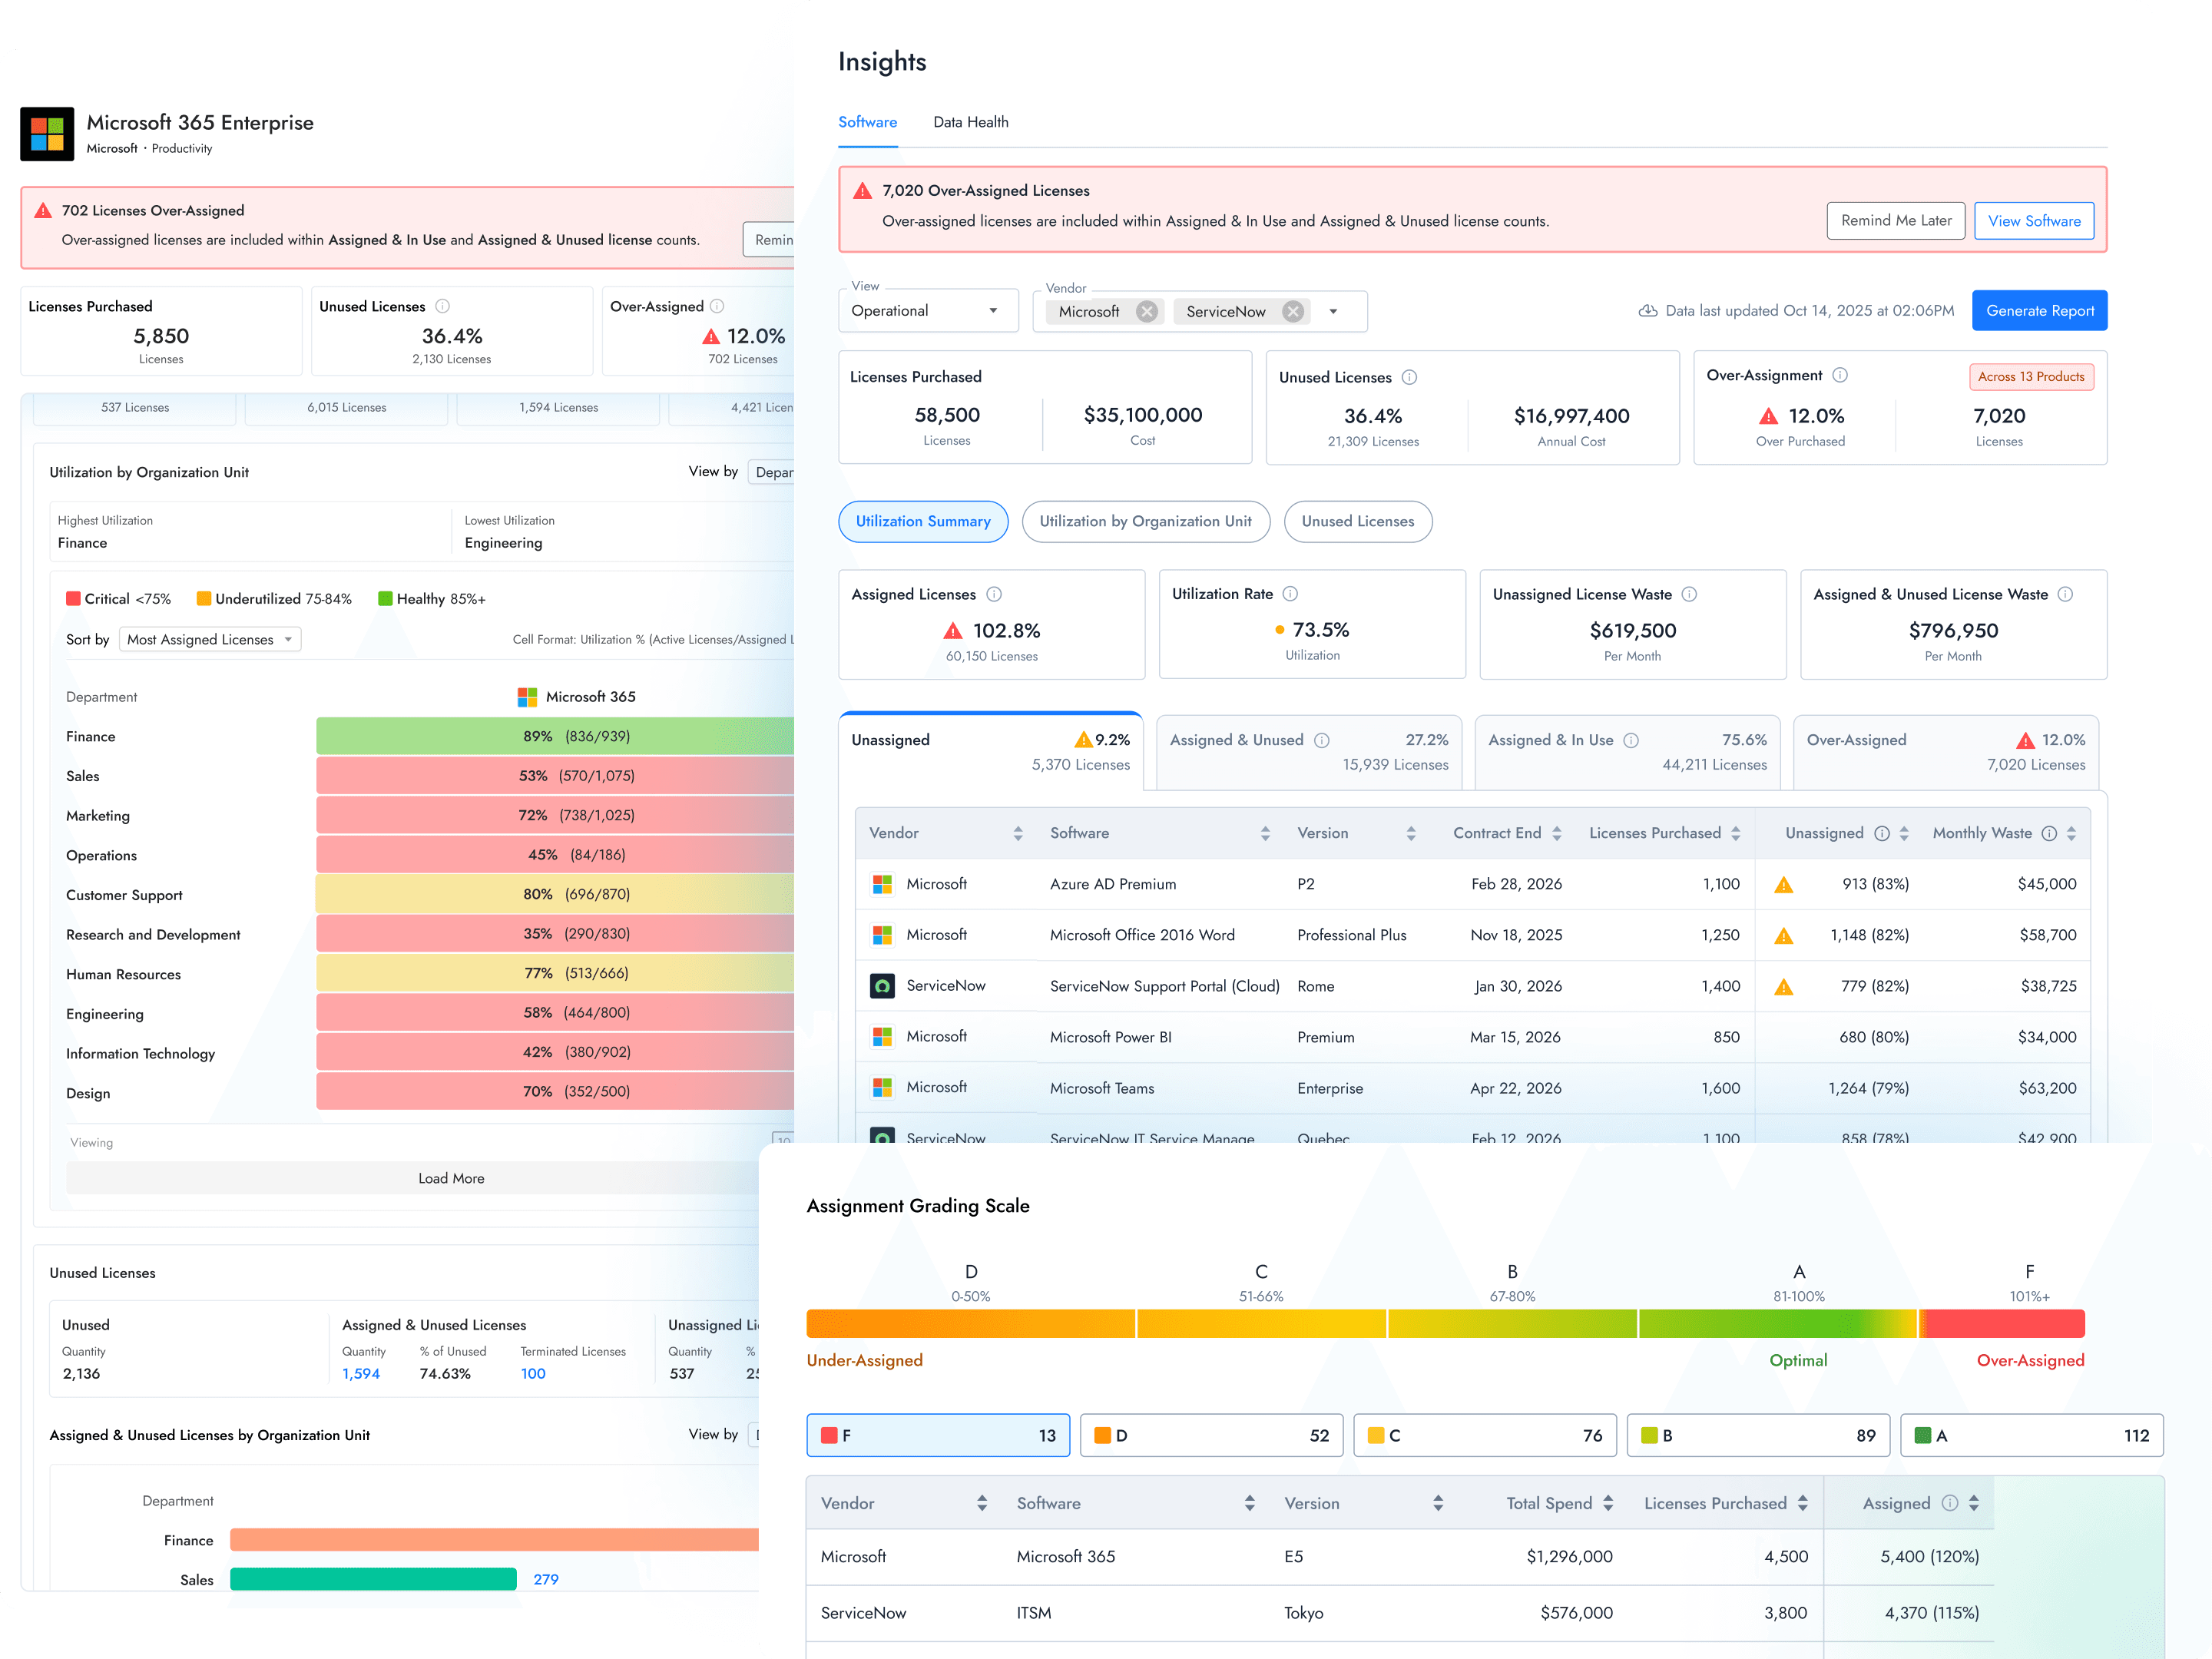
Software Observability for Autonomous Operations
Problem
Enterprises lack visibility into their software ecosystems. Disconnected systems make it hard to know what’s owned, who’s using it, and where spend is wasted.
This blind spot costs organizations millions in unused licenses, redundant purchases, and compliance violations.
Contributions
Led design for XOPS’s software lifecycle observability system, establishing visibility across utilization, compliance, and spend — the foundation for autonomous license optimization.
Designed the software overview experience showing software across lifecycle stages, from procurement to renewal, giving enterprises clarity on portfolio health.
Empowered Fortune 500 organizations to reduce waste, improve compliance, and achieve measurable cost savings through actionable visibility.
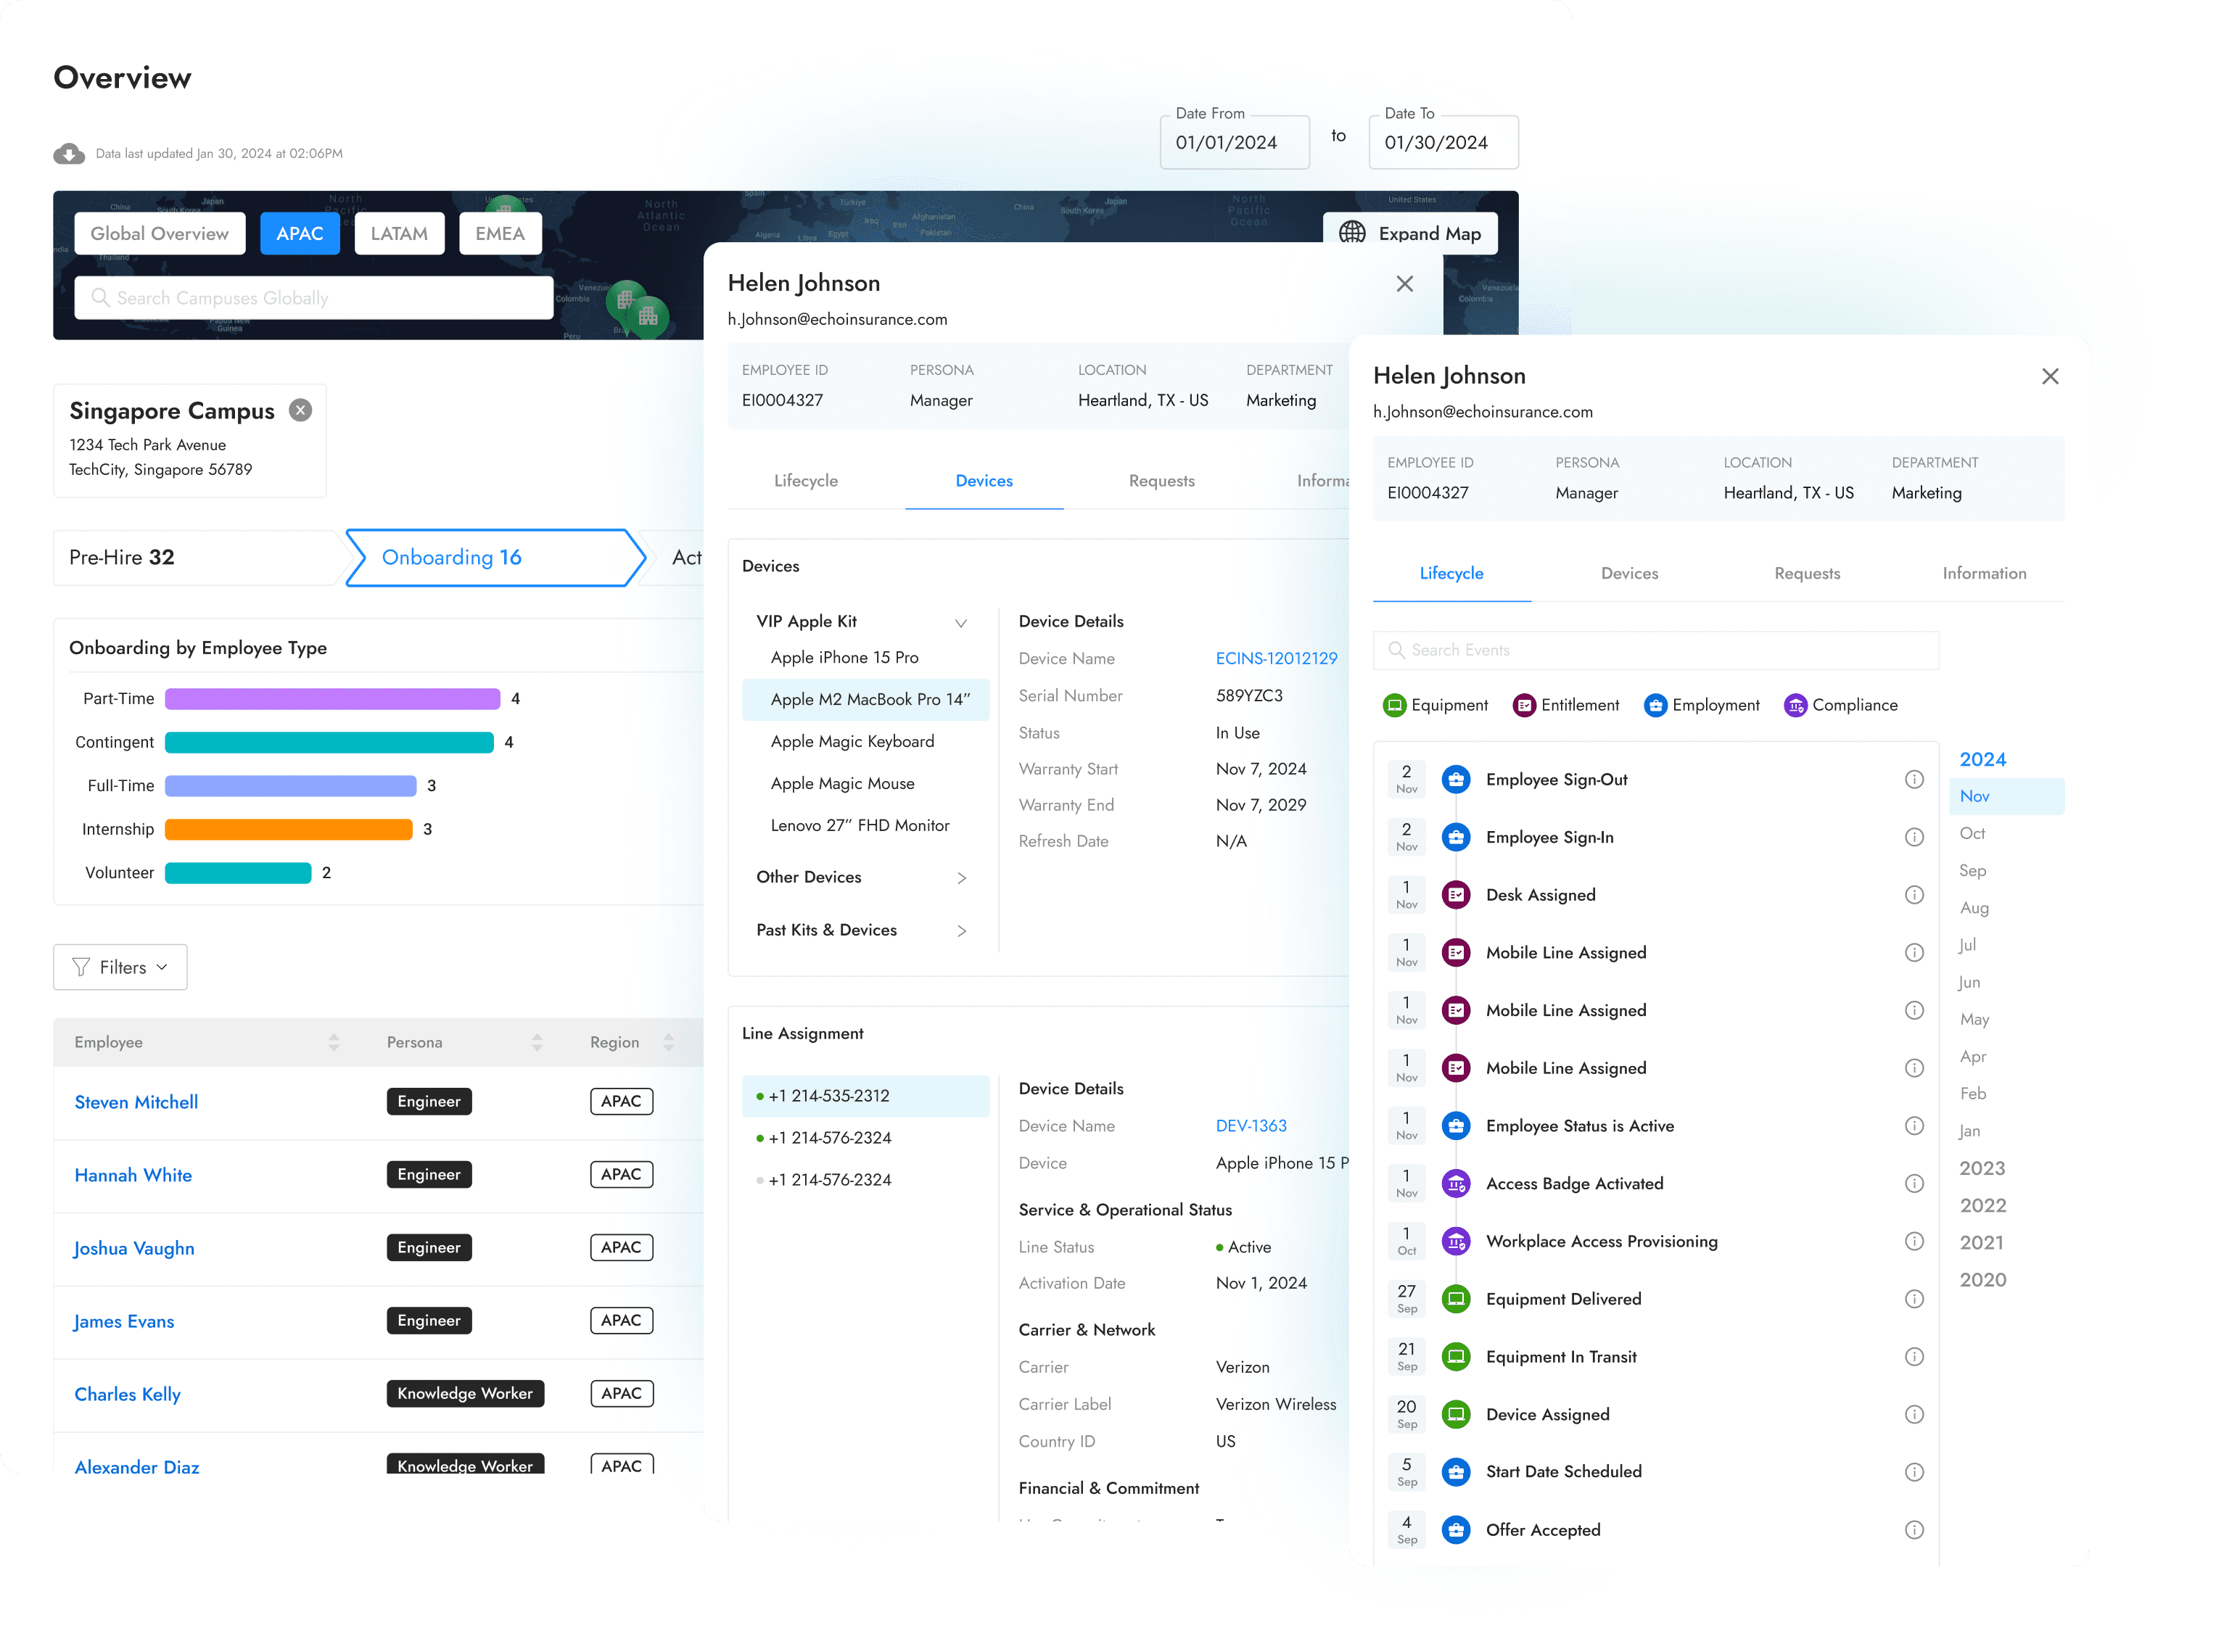
Employee Lifecycle Observability
Case study coming soon.
Problem
Enterprises lack a clear view of workforce distribution across lifecycle stages and regions. Without unified visibility, teams can’t anticipate onboarding demand or plan asset readiness.
Contributions
Expanded XOPS’s observability framework to provide global-to-campus visibility for IT and operations teams.
Refined employee profiles and filtering experiences for faster data retrieval and reduced cognitive load.
Introduced bulk editing as a scalable capability that allowed teams to apply changes efficiently across filtered employee groups by region, lifecycle stage, and organization.
" height="13.08465px" id="JTsXOCkRd" transform="translate(0.49 5.36)" width="2.6703460000000003px"/><path d="M 2.67 0 L 0 0 L 0 9.969 L 2.67 9.969 Z" fill="rgb(255, 255, 255)" height="9.969323px" id="SXnADBiQY" transform="translate(6.277 0.376)" width="2.67035px"/><path d="M 2.67 0 L 0 0 L 0 9.969 L 2.67 9.969 Z" fill="rgb(49, 216, 145)" height="9.9692px" id="IiTxxlnOU" transform="translate(6.277 13.462)" width="2.67035px"/><path d="M 2.67 0 L 0 0 L 0 13.085 L 2.67 13.085 Z" fill="rgb(49, 216, 145)" height="13.08465px" id="zStIOMbOs" transform="translate(12.064 5.36)" width="2.670300000000001px"/><path d="M 8.485 13.079 L 8.485 7.268 L 1.808 7.268 L 1.808 13.079 L 0 13.079 L 0 0 L 1.808 0 L 1.808 5.59 L 8.485 5.59 L 8.485 0 L 10.294 0 L 10.294 13.079 Z" fill="rgb(255, 255, 255)" height="13.079079999999998px" id="aQTrDBeWk" transform="translate(21.326 5.357)" width="10.294px"/><path d="M 8.447 6.623 C 7.95 8.191 6.529 9.426 4.464 9.426 C 2.085 9.426 0 7.693 0 4.686 C 0 1.9 2.011 0 4.243 0 C 6.973 0 8.504 1.881 8.504 4.649 C 8.505 4.834 8.493 5.019 8.467 5.202 L 1.787 5.202 C 1.824 6.789 2.968 7.898 4.462 7.898 C 5.9 7.898 6.62 7.105 6.952 6.108 Z M 6.694 3.8 C 6.657 2.527 5.827 1.532 4.259 1.532 C 2.802 1.532 1.917 2.657 1.842 3.8 Z" fill="rgb(255, 255, 255)" height="9.42647px" id="Y7YdbzJmL" transform="translate(32.917 9.286)" width="8.504156401608327px"/><path d="M 2.694 4.075 L 5.092 3.725 C 5.627 3.65 5.774 3.374 5.774 3.061 C 5.774 2.194 5.203 1.475 3.856 1.475 C 2.639 1.475 1.956 2.231 1.845 3.264 L 0.185 2.877 C 0.369 1.179 1.901 0 3.819 0 C 6.475 0 7.508 1.513 7.508 3.247 L 7.508 7.691 C 7.503 8.179 7.54 8.666 7.619 9.148 L 5.922 9.148 C 5.854 8.752 5.823 8.35 5.83 7.948 C 5.443 8.576 4.557 9.424 2.971 9.424 C 1.163 9.424 0 8.17 0 6.769 C 0 5.182 1.163 4.296 2.694 4.075 Z M 5.774 5.348 L 5.774 4.942 L 3.062 5.348 C 2.324 5.459 1.771 5.882 1.771 6.675 C 1.771 7.339 2.324 7.966 3.21 7.966 C 4.63 7.967 5.774 7.284 5.774 5.348 Z" fill="rgb(255, 255, 255)" height="9.424340000000003px" id="QxwEcF5a2" transform="translate(42.277 9.289)" width="7.618600000000001px"/><path d="M 0 12.581 L 0 0.203 L 1.679 0.203 L 1.679 1.587 C 2.158 0.702 3.21 0 4.649 0 C 7.304 0 8.726 2.048 8.726 4.63 C 8.726 7.269 7.194 9.316 4.593 9.316 C 3.228 9.316 2.196 8.671 1.717 7.877 L 1.717 12.581 Z M 4.335 1.531 C 2.749 1.531 1.697 2.859 1.697 4.629 C 1.697 6.456 2.749 7.765 4.335 7.765 C 5.94 7.765 6.955 6.456 6.955 4.629 C 6.955 2.859 5.959 1.531 4.335 1.531 Z" fill="rgb(255, 255, 255)" height="12.58127px" id="QQFJSFTgy" transform="translate(51.422 9.361)" width="8.725899999999996px"/></svg>)
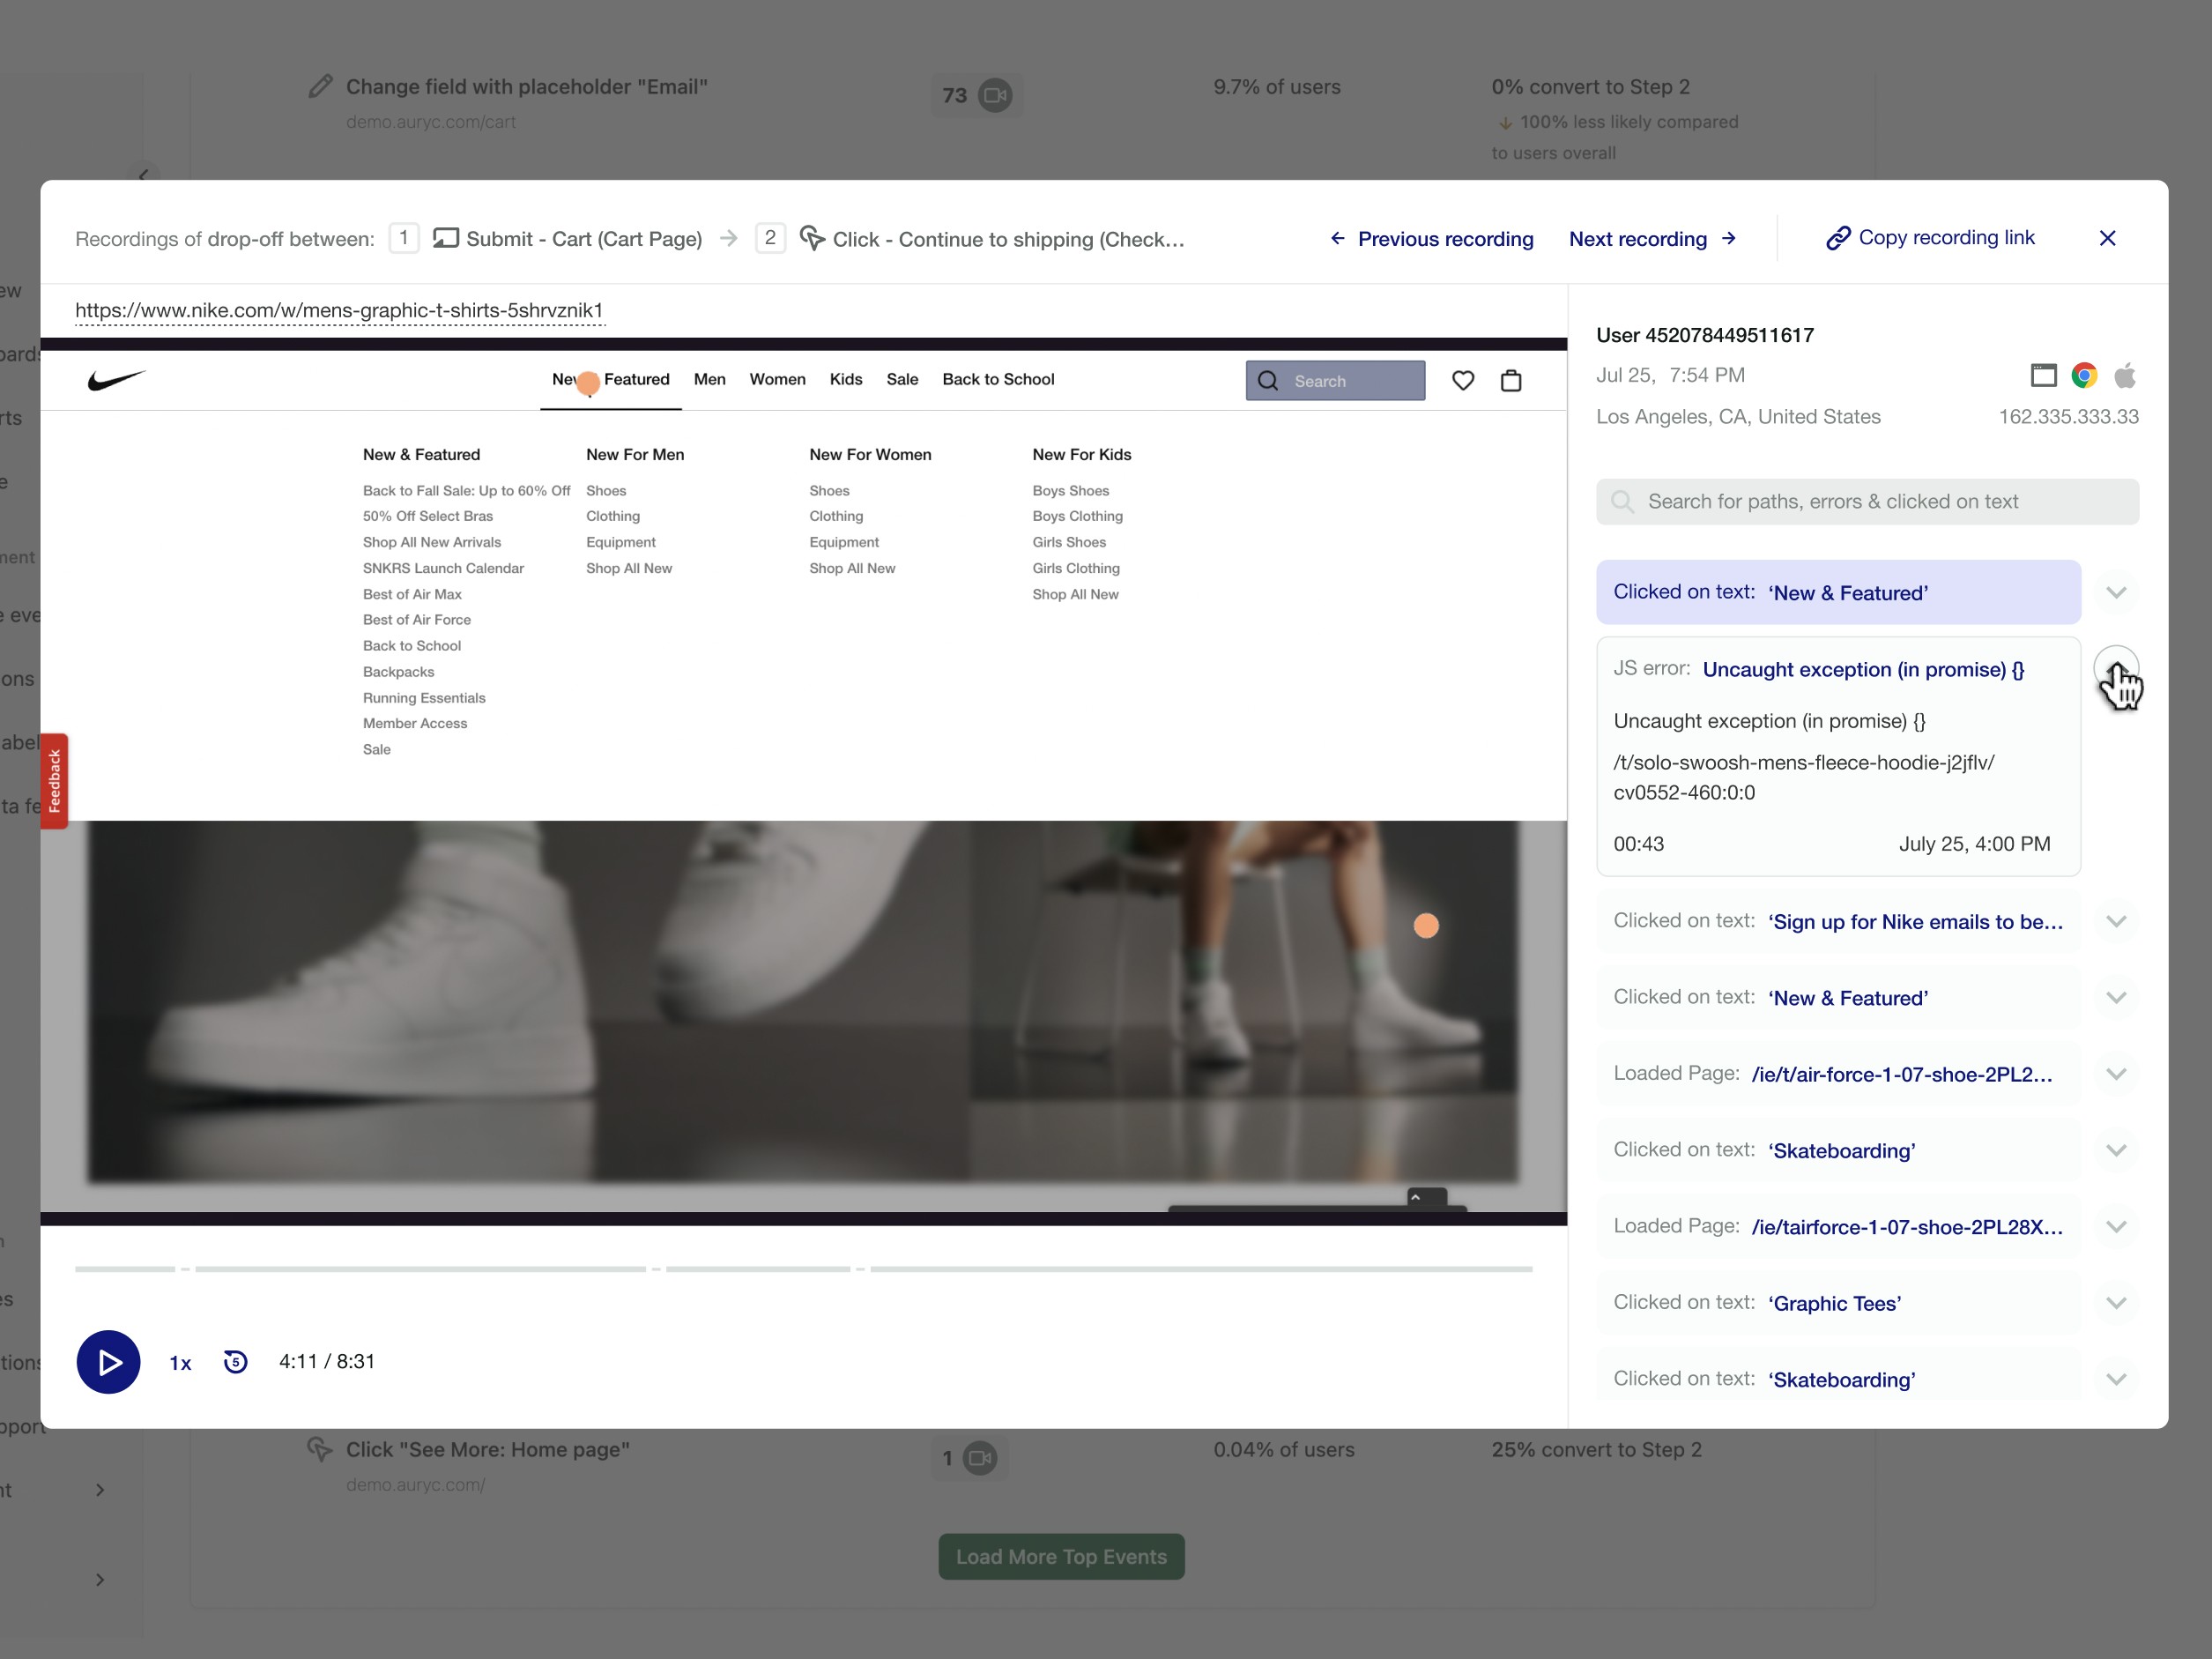
Session Replay
Problem
Heap’s early session replay tool did not provide the essential context support and product teams needed to understand and resolve user issues.
Without session details, searchable event logs, or access to past sessions, teams were forced to watch full recordings to find insights, slowing decision-making and limiting their ability to resolve issues at scale.
Contributions
Designed replay onboarding, settings, and player experiences that increased engagement by 10% and elevated Heap’s market position before its acquisition by Contentsquare.
Unified replay with Heap’s analytics suite, turning isolated video sessions into actionable, data-driven user insights.
Delivered a streamlined replay experience that drove customer adoption and conversions from competing tools.
"/><stop offset="1" stop-color="rgb(255, 204, 0)"/></linearGradient></defs><path d="M 0 24 L 0 0 L 87.117 0 L 87.117 24 Z" fill="transparent" height="24px" id="abrshXef4" width="87.11670000000001px"/><path d="M 10.154 10.199 C 10.206 10.326 10.232 10.461 10.232 10.596 C 10.224 10.752 10.156 10.9 10.047 11.012 C 9.889 11.168 9.667 11.246 9.447 11.225 C 9.168 11.225 8.921 11.046 8.836 10.778 L 7.809 8.322 L 2.404 8.322 L 1.396 10.773 C 1.31 11.038 1.066 11.217 0.785 11.22 C 0.564 11.24 0.343 11.163 0.184 11.007 C 0.075 10.895 0.01 10.747 0 10.591 C 0 10.456 0.026 10.321 0.078 10.194 L 4.107 0.657 C 4.289 0.218 4.601 0 5.043 0 L 5.199 0 C 5.625 0 5.937 0.218 6.135 0.657 L 10.148 10.202 Z M 7.268 7.008 L 5.118 1.844 L 2.969 7.011 L 7.268 7.011 Z" fill="rgb(255, 255, 255)" height="11.228072286404519px" id="bv8TJn2FM" transform="translate(32.863 6.361)" width="10.2316px"/><path d="M 8.381 0 C 8.573 0 8.758 0.078 8.893 0.213 C 9.041 0.345 9.124 0.535 9.122 0.735 L 9.122 7.003 C 9.122 8.384 8.625 9.467 7.63 10.254 C 6.759 10.957 5.667 11.329 4.549 11.3 C 3.335 11.3 2.308 10.952 1.471 10.254 C 0.489 9.454 0 8.371 0 7.003 L 0 0.735 C 0 0.543 0.078 0.358 0.213 0.223 C 0.34 0.08 0.525 0 0.717 0 C 0.91 0 1.094 0.078 1.23 0.213 C 1.375 0.348 1.456 0.537 1.453 0.735 L 1.453 7.042 C 1.453 7.984 1.775 8.719 2.423 9.249 C 3.681 10.228 5.443 10.228 6.701 9.249 C 7.346 8.706 7.671 7.971 7.671 7.042 L 7.671 0.735 C 7.668 0.543 7.741 0.358 7.877 0.223 C 8.006 0.08 8.188 0 8.381 0 Z" fill="rgb(255, 255, 255)" height="11.301606786996484px" id="kKzpgxtz8" transform="translate(44.685 6.365)" width="9.121659163457963px"/><path d="M 8.643 10.428 C 8.643 10.615 8.573 10.796 8.441 10.931 C 8.305 11.074 8.116 11.152 7.918 11.144 C 7.726 11.152 7.536 11.082 7.396 10.952 C 7.258 10.815 7.182 10.625 7.193 10.43 L 7.193 9.947 C 7.193 9.096 7.099 8.472 6.912 8.078 C 6.738 7.696 6.47 7.366 6.132 7.12 C 5.802 6.881 5.334 6.761 4.729 6.761 L 1.451 6.761 L 1.451 10.428 C 1.451 10.617 1.375 10.799 1.238 10.931 C 1.1 11.072 0.91 11.149 0.715 11.144 C 0.322 11.139 0.005 10.822 0 10.43 L 0 0.735 C 0 0.543 0.078 0.358 0.213 0.223 C 0.341 0.08 0.525 0 0.718 0 L 4.417 0 C 5.862 0 6.961 0.312 7.71 0.935 C 8.396 1.488 8.781 2.334 8.742 3.214 C 8.742 3.825 8.563 4.419 8.23 4.928 C 7.856 5.486 7.297 5.894 6.652 6.078 C 7.414 6.268 7.968 6.818 8.319 7.732 C 8.558 8.363 8.669 9.033 8.649 9.706 L 8.649 10.428 Z M 4.326 5.377 C 5.217 5.377 5.932 5.206 6.475 4.866 C 7.008 4.541 7.323 3.952 7.289 3.329 C 7.289 2.698 7.076 2.22 6.65 1.898 C 6.145 1.537 5.345 1.355 4.248 1.355 L 1.453 1.355 L 1.453 5.38 L 4.326 5.38 Z" fill="rgb(255, 255, 255)" height="11.144923774277826px" id="VlInfkZck" transform="translate(57.036 6.444)" width="8.744904365787502px"/><path d="M 7.96 0.373 C 8.074 0.153 8.301 0.012 8.55 0.005 C 8.935 -0.021 9.268 0.267 9.294 0.651 C 9.294 0.667 9.294 0.685 9.294 0.7 C 9.299 0.867 9.252 1.03 9.158 1.168 L 5.363 6.465 L 5.363 10.515 C 5.355 10.907 5.041 11.224 4.648 11.229 C 4.456 11.229 4.271 11.151 4.136 11.016 C 3.993 10.889 3.913 10.705 3.913 10.513 L 3.913 6.462 L 0.117 1.165 C 0.037 1.022 -0.005 0.861 0 0.698 C 0 0.519 0.065 0.347 0.185 0.215 C 0.325 0.064 0.523 -0.014 0.728 0.002 C 0.981 0.01 1.212 0.15 1.339 0.371 L 4.651 5.187 L 7.963 0.371 Z" fill="rgb(255, 255, 255)" height="11.229329695700358px" id="pWqGqDEjZ" transform="translate(67.313 6.359)" width="9.294025332606438px"/><path d="M 8.599 9.248 C 8.711 9.204 8.831 9.183 8.947 9.191 C 9.103 9.191 9.252 9.258 9.356 9.375 C 9.467 9.484 9.53 9.635 9.53 9.791 C 9.545 10.053 9.4 10.299 9.161 10.414 C 8.659 10.699 8.129 10.933 7.578 11.104 C 6.92 11.299 6.236 11.39 5.55 11.374 C 4.796 11.382 4.047 11.25 3.34 10.987 C 2.683 10.743 2.085 10.359 1.588 9.866 C 0.53 8.835 0 7.441 0 5.688 C 0 3.935 0.53 2.541 1.588 1.51 C 2.607 0.503 3.933 0.002 5.56 0.002 C 6.247 -0.014 6.933 0.085 7.588 0.292 C 8.03 0.435 8.461 0.614 8.877 0.825 C 9.083 0.918 9.27 1.051 9.428 1.212 C 9.504 1.323 9.54 1.456 9.535 1.588 C 9.535 1.744 9.473 1.894 9.361 2.004 C 9.262 2.118 9.116 2.185 8.966 2.188 C 8.844 2.193 8.721 2.172 8.607 2.131 C 8.191 1.902 7.754 1.718 7.299 1.58 C 6.761 1.432 6.202 1.365 5.644 1.378 C 5.025 1.367 4.411 1.482 3.837 1.715 C 3.327 1.923 2.87 2.237 2.49 2.634 C 1.781 3.408 1.432 4.426 1.443 5.691 C 1.456 6.955 1.804 7.973 2.49 8.747 C 3.265 9.585 4.331 10.003 5.685 10.003 C 6.226 10.014 6.764 9.946 7.284 9.801 C 7.739 9.663 8.181 9.479 8.599 9.25 Z" fill="rgb(255, 255, 255)" height="11.376059969596621px" id="GW6KJApM3" transform="translate(77.574 6.285)" width="9.535488136632594px"/><path d="M 26.914 12.347 L 14.515 0.351 C 14.031 -0.117 13.262 -0.117 12.778 0.351 L 8.492 4.497 L 5.76 7.146 L 3.09 9.727 L 3.056 9.76 L 0.379 12.349 C -0.115 12.829 -0.128 13.616 0.353 14.112 C 0.425 14.185 0.506 14.25 0.592 14.304 L 12.991 21.938 C 13.392 22.187 13.899 22.187 14.299 21.938 L 26.701 14.304 C 27.289 13.943 27.471 13.175 27.109 12.591 C 27.055 12.502 26.99 12.422 26.914 12.349 Z M 13.647 20.505 L 1.751 13.183 L 3.714 11.282 L 12.906 16.966 C 13.127 17.103 13.384 17.176 13.644 17.176 L 13.644 15.592 L 4.871 10.168 L 6.394 8.693 L 12.908 12.687 C 13.129 12.822 13.384 12.894 13.644 12.894 L 13.644 11.305 L 7.551 7.566 L 9.126 6.042 L 12.991 8.441 C 13.186 8.566 13.415 8.631 13.647 8.631 L 13.647 7.021 L 10.28 4.931 L 13.647 1.672 L 25.542 13.183 L 13.647 20.5 Z" fill="url(%23yRIKuQH8v-293505355-linear-gradient)" height="22.125016249999998px" id="yRIKuQH8v" transform="translate(-0.004 0.935)" width="27.29495163408053px"/><path d="M 7.37 0.371 C 7.143 0.005 6.665 -0.109 6.298 0.114 L 0 3.973 L 0 5.559 C 0.26 5.559 0.512 5.486 0.733 5.351 L 7.112 1.444 C 7.479 1.218 7.596 0.74 7.37 0.371 Z" fill="rgb(137, 172, 241)" height="5.558918650614608px" id="OxwqSey2T" transform="translate(13.65 12.556)" width="7.484945230321589px"/><path d="M 3.626 0.369 C 3.4 0.002 2.919 -0.109 2.553 0.117 L 0 1.701 L 0 3.29 C 0.263 3.29 0.517 3.214 0.738 3.077 L 3.374 1.444 C 3.741 1.218 3.852 0.737 3.626 0.371 Z" fill="rgb(255, 117, 117)" height="3.2896499603438px" id="W8piJyFp2" transform="translate(13.649 10.543)" width="3.743098361294848px"/><path d="M 3.002 0.376 C 2.779 0.007 2.301 -0.11 1.931 0.113 L 0 1.284 L 0 2.899 C 0.229 2.899 0.452 2.837 0.647 2.718 L 2.74 1.448 C 3.106 1.225 3.223 0.747 3 0.378 Z" fill="rgb(116, 205, 176)" height="2.8993517679993737px" id="KHtUGaJD4" transform="translate(13.65 6.68)" width="3.113276166194794px"/></svg>)
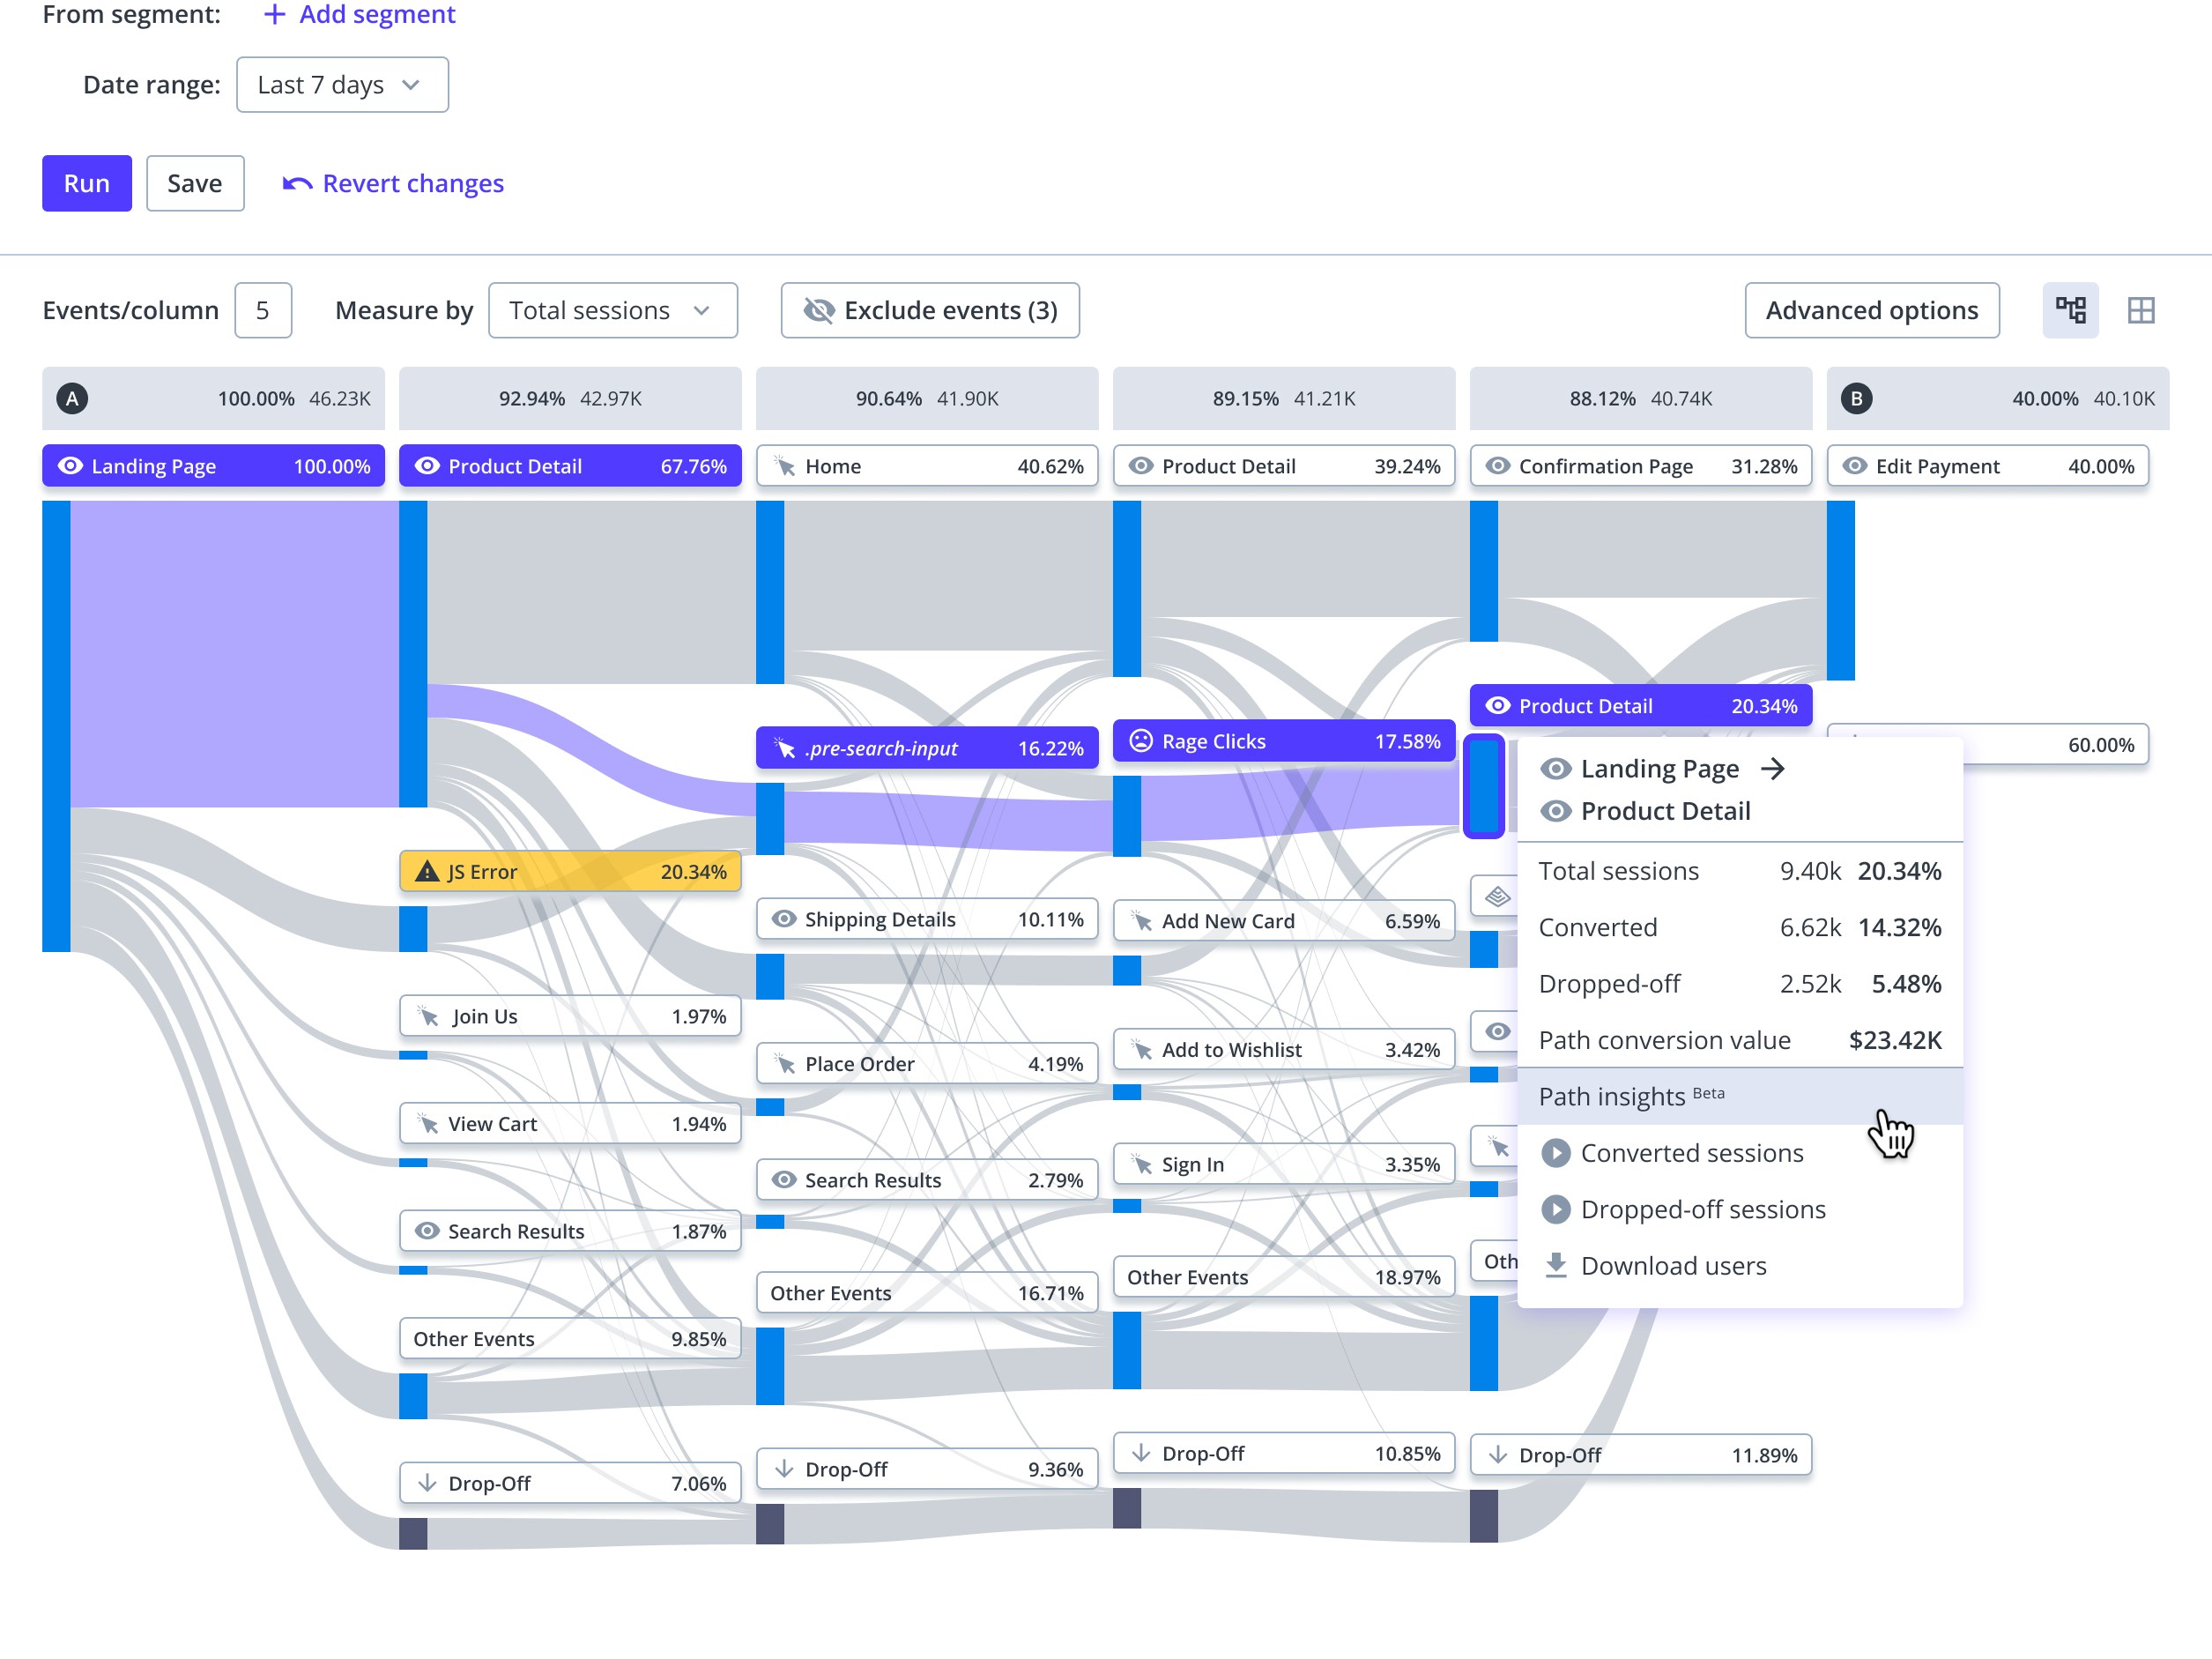
Path Analysis
Problem
Teams struggled to visualize user journeys without technical help. Existing tools produced cluttered charts that hid valuable insights and lacked behavioral context.
Contributions
Designed a self-service path analysis tool that gave non-technical teams clear visibility into user flows.
Simplified complex data through a focused Sankey visualization with event exclusion to reduce noise.
Integrated behavioral and frustration signals to reveal why users dropped off.
Result: 20% ARR growth, 15% contract expansion, 78% adoption, and 92% retention.
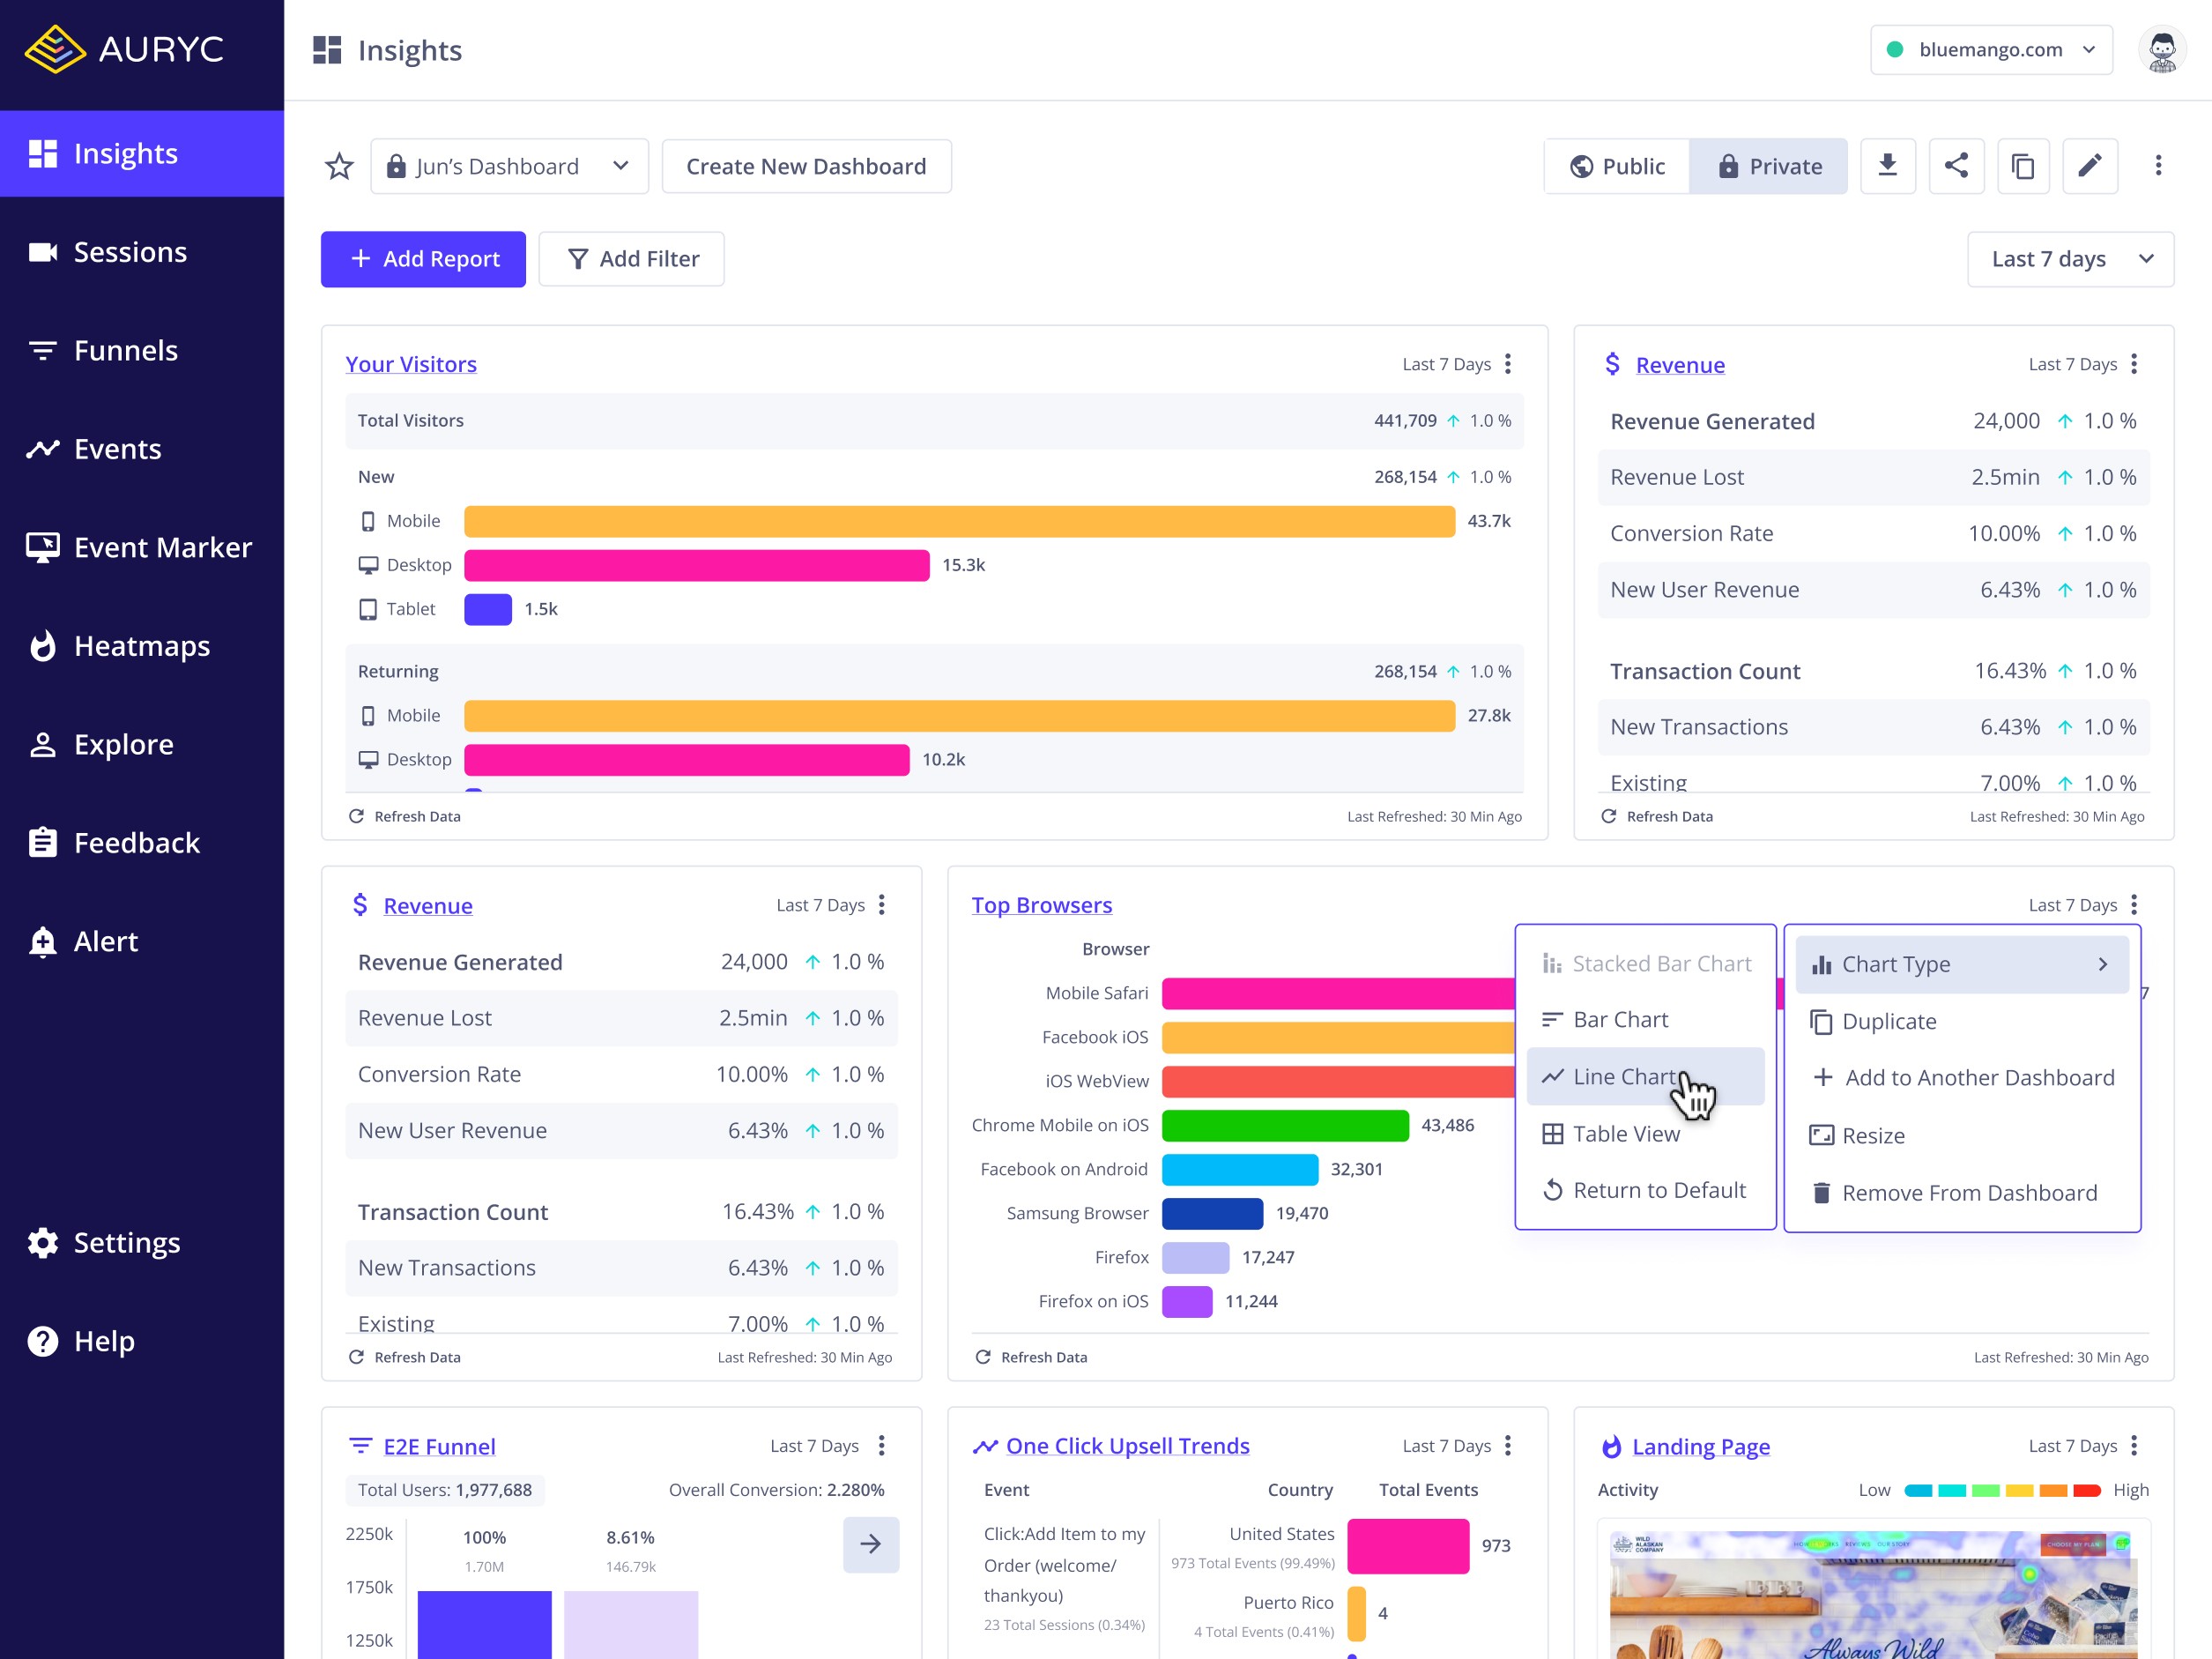
Auryc Dashboards
Case study coming soon.
Problem
Customers relied on support to edit dashboards, and dense reports made insights hard to surface. The outdated design slowed analysis and limited their ability to explore data independently.
Contributions
Initiated and led the redesign of Auryc Dashboards to give customers self-service control over their analytics.
Designed a flexible, editable dashboard system that eliminated support dependencies for report customization.
Standardized the UI across reports, creating consistency throughout the platform experience.
Rebuilt all chart types to support responsive layouts and allow users to expand reports to establish hierarchy within their dashboards.