Software
Observability
Real-time visibility into license ownership, spend, and utilization to identify waste and drive cost optimization for the Fortune 500.
Company
Role
Lead Designer
Timeline
Q2 2025
Platform Expansion
0 → 1Software unlocked a new layer of cross-system automation, opening a new revenue stream for XOPS beyond employee and device data.
Millions Reclaimed
Autonomous license optimization enabled customers like Broadcom to identify and recover millions of dollars in waste.
Revenue & Sales Driver
The new module became a consistent presence in enterprise sales demos, revealing the depth of XOPS' system of intelligence.
What must we know to guarantee zero waste, total compliance, and optimized spend?
What do we own?
How is it used?
What does it cost?
Are we compliant?
Software Asset Manager
Financial Specialist
IT Operations Manager
Building a unified and actionable solution meant understanding the core questions through each role's distinct lens.
I collected each role's questions across the four categories, then worked with experts to filter the critical ones that would define our MVP.
Financial Specialist
How much are we currently spending with each vendor?
How much is each organizational unit spending on software?
Which department, company entity, and region owns each software license?
What products have auto renew?
What renewals are coming up this year?
How much software is locked into long term contracts vs. monthly?
How much do we still owe on contracts?
Where are we paying for overlapping tools?
How much prepaid software support and maintenance credit do we have left for this year?
What is the total cost of all software contracts and licenses that don't have an assigned team or budget owner?
For each vendor, what are our minimum spend promises?
For each vendor, do we have any prepaid credits?
Software Asset Manager
Responsible for inventory, vendor compliance, and license optimization, and defending the organization during vendor audits.
How many licenses are purchased?
How many licenses are assigned/unassigned/active/inactive overall?
How many licenses are assigned/unassigned/active/inactive per title?
Licenses broken down by license model?
What products have expired purchase records?
Does the number of licenses we're using match our vendor/publisher records?
What are the termination clauses for all software contracts?
What are the exact contract start and end dates, renewal notice windows?
What % of software discovered matches a purchase record?
What software is unrecognized or unmanaged?
What usage rights are there?
Which entitlements are affected by mergers, divestitures, or entity changes?
What software is present in procurement records but missing in inventory?
IT Operations Manager
What software and tools are installed across all of our computers, servers, and cloud environments?
Which software is end-of-life?
Which software versions are outdated?
Which apps use our SSO system to log in, and which ones are managed separately?
Which software is no longer supported by vendors?
Which key business apps rely on underlying tech or infrastructure?
Which devices are running software that isn't approved?
How much of our software is built in-house versus bought from vendors?
How much of our network are we tracking software for?
Which entitlements are affected by mergers, divestitures, or entity changes?
The groundwork allowed me to close the knowledge gap fast, move past the basics and straight product alignment.
Chief Product Officer
Former CIO
VP of Customer Operations
Former Director of IT & Technology Infrastructure
Director of Product
Former Lead Data & Gen AI Architect
No easy way to define the true cost of software.
Licenses purchased, assignments, and spend lived in separate systems owned by different teams, with no unified view.
Renewals were a recurring financial risk.
No consolidated spend data or proactive renewal alerts led to contracts auto-renewing for unused software before anyone could intervene.
Utilization data was rarely actionable.
Usage data was pulled in isolation, disconnected from ownership, compliance, and cost context.
One source of truth for ownership, spend, and health.
Create a unified view so finance and IT share the same numbers, and surface compliance risk before it becomes a liability.
Proactive renewal signaling and usage data for negotiation leverage.
Pair renewal deadlines with urgency flags, usage, and assignment data to enable early action, so decisions to cancel, renegotiate, or downsize are addressed in time and backed by verified data.
Target unused licenses for recoverable spend.
Translate low utilization into a dollar opportunity, and help teams focus reclamation on the departments and employees with the greatest impact.
Stakeholders can identify unused software, what it’s costing them and where inactive licenses are concentrated to prioritize reclamation.
To incorporate software into the platform I mapped it to XOPS’ observability framework.
Full visibility into enterprise assets, asset relationships, and end-to-end operations by unifying data across HR, IT, financial, and third-party systems.
The Framework.
Due to higher priorities,
Data Ops had not started integration work.
I was in the dark in terms of the data we could count on. I reached out to our director of engineering for insight on what integrations would power this solution.
The data dictionary.
Based on API documentation and further research using Claude, I created a living document with the data points, their definitions, calculations and sources that were required to achieve our goals.
Document Intent
This document introduces the core pain points in software lifecycle management and establishes shared terminology, best-practice definitions, and the data elements needed to support the Overview, Software Portfolio, and Software Asset Profile experiences. Its goal is to align teams around the calculations, system sources, and decision-driving insights that power Software Observability.
I kicked off design with the modules entry point, the Software Overview.
Intent: provide stakeholders with high-level portfolio health check that answered their most critical questions.
I built this first concept to test my assumptions, answer open questions,
and share something tangible to align on.
Through Prototype 01 I was able to identify gaps in my thinking about the problem space.
Working with DataOps and experts, we scoped the data to fit our timeline, priorities, and highest impact.
Cloud subscriptions hold most of the spend, so Phase 1 starts there.
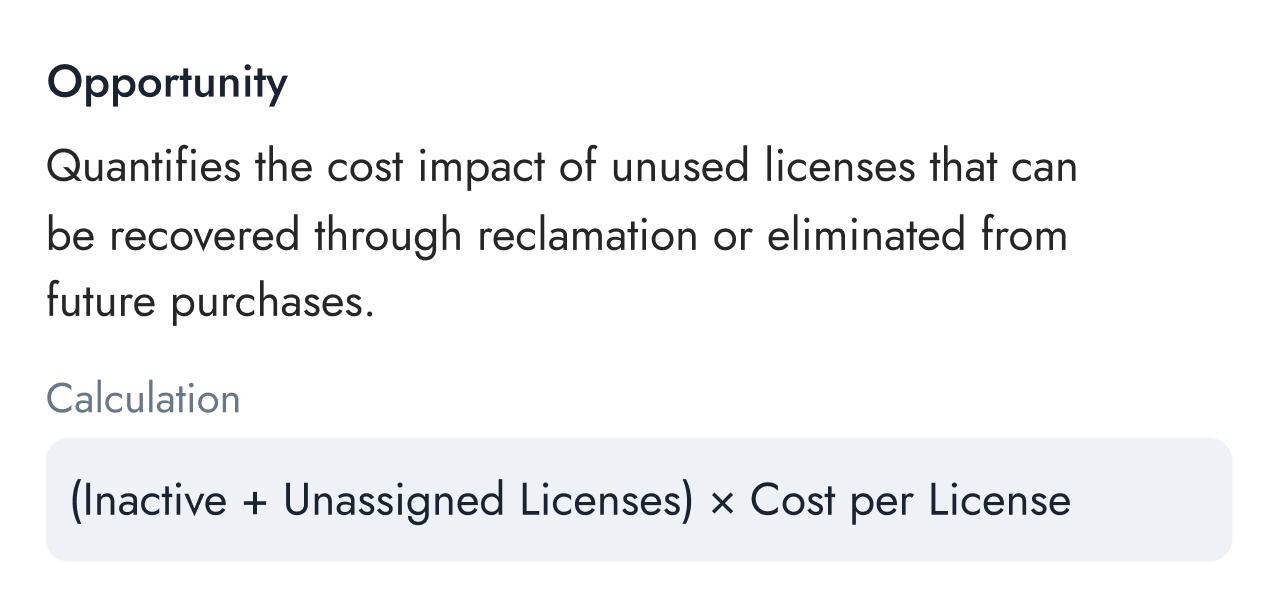
Seat price × inactive licenses puts a dollar figure on what can be reclaimed.
Inactive, unassigned and active licenses become clear status tags.
Waste by department and cost center, down to the people holding the licenses.
Licenses still assigned to former employees are the quickest wins.
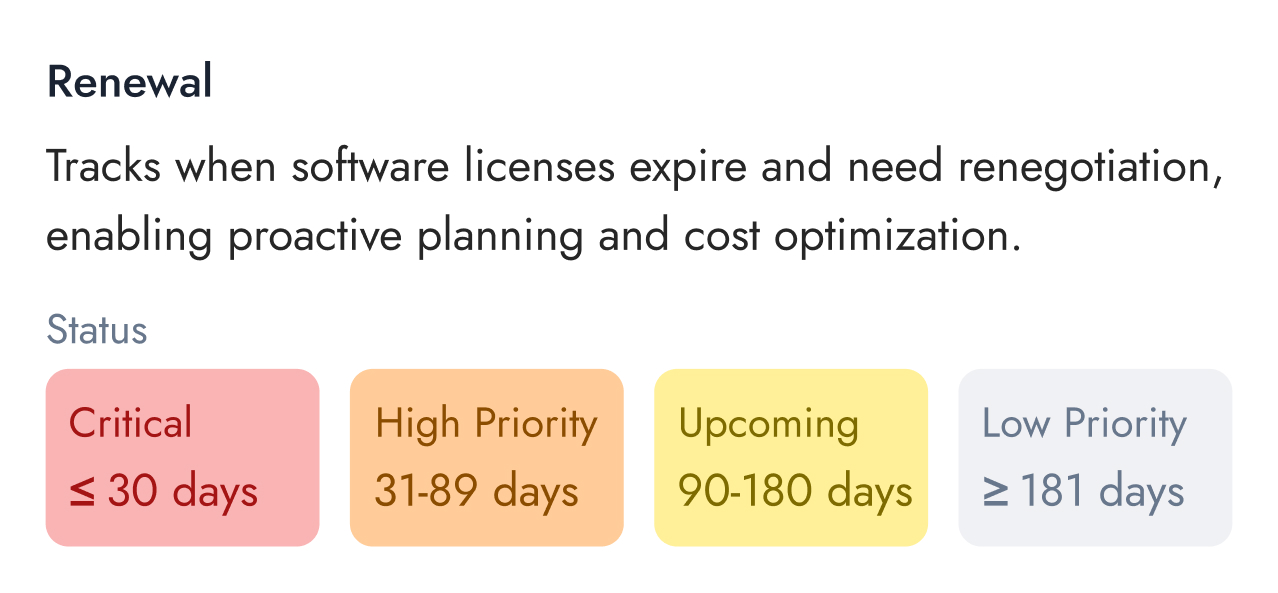
Renewal date and countdown show when a decision is due.
Compliance narrowed to the one risk the data could show: more assigned than owned.
Commitments, minimums and termination clauses need contract data we didn't have yet.
Filtering by region and location shows where licenses and spend sit across the organization.
Installed software across servers and devices waits on integration work.
Open source, perpetual, consumption-based and the rest follow once SaaS is solid.
The updated overview helped answer our in a more specific and actionable way.
A complete, filterable catalog of everything owned.
Every column was redesigned to communicate status and urgency at a glance.
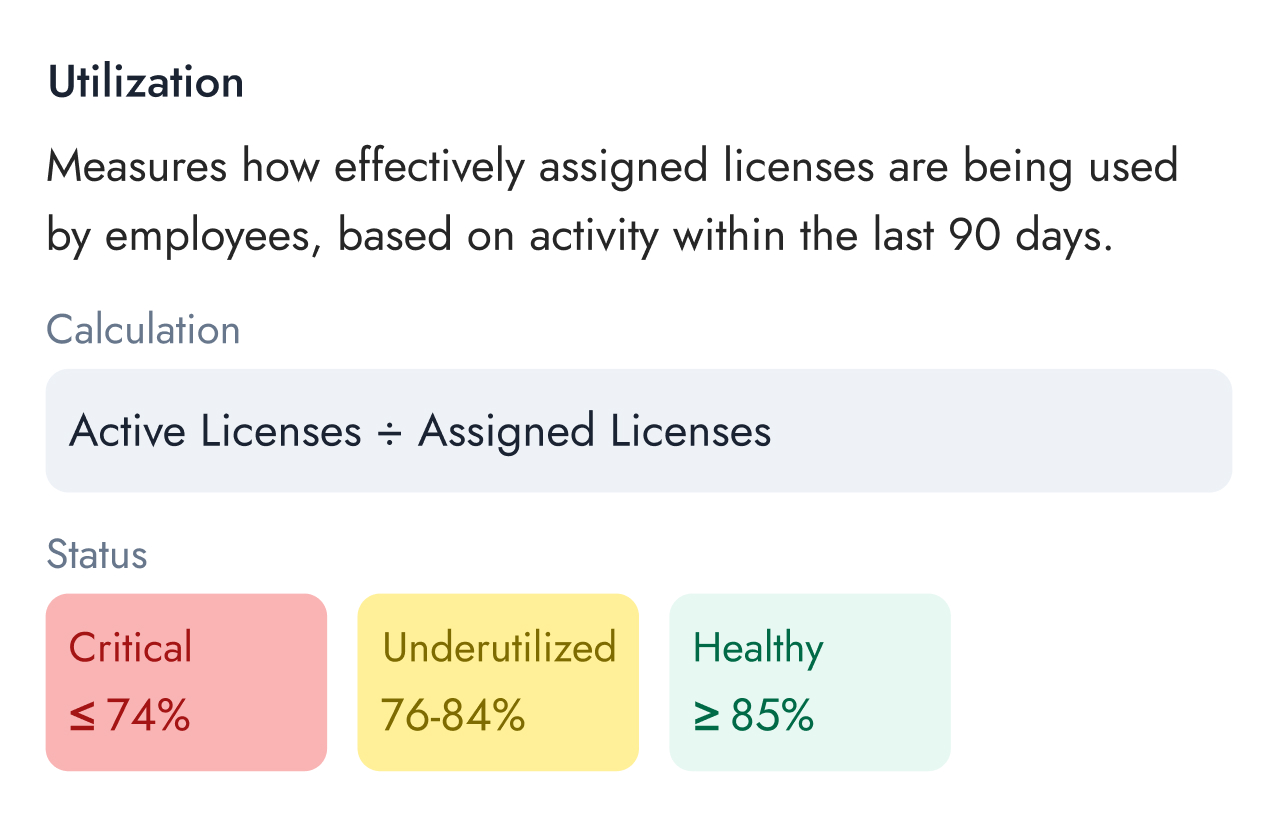
Tooltips providing label definitions and calculation transparency, so users can interpret data with confidence.
The source of truth for a unique asset, unifying identity data, organizational context, and operational history.
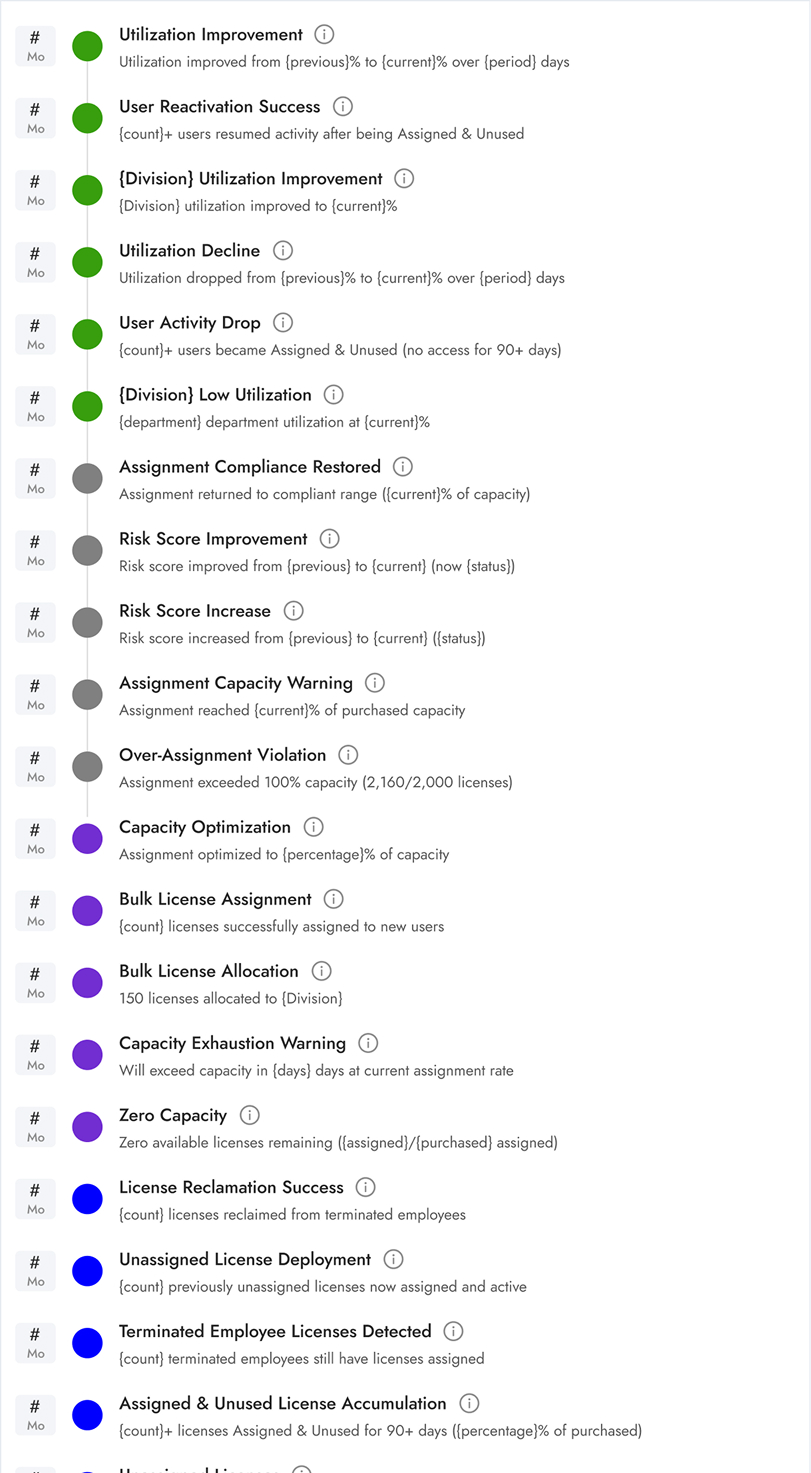
A record of key events across an asset's operational life.